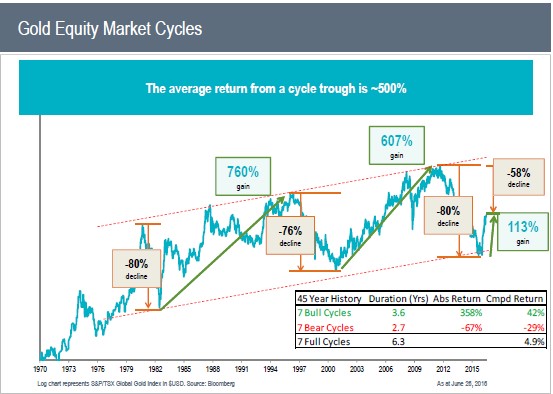
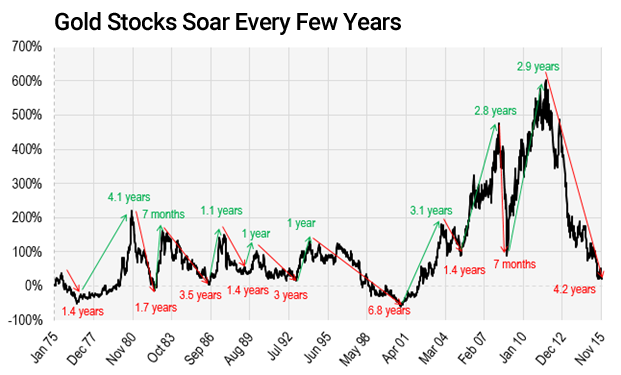
Over the past 45 years, there have been 7 bull cycles and 7 bear cycles with varying duration and percentage gains.
Over the past 45 years, there have been 7 bull cycles and 7 bear cycles with varying duration and percentage gains.
Gold hit its high in 2011 at a bit over $1900. The most recent low was $1,045 in 2015 and currently it stands at around $1,250. Gold Shares have had an even wilder ride with the average gold stock down up to 70% – clearly not for the faint-hearted investor.
No one has a crystal ball and I certainly do not, but the low in gold is close – perhaps this recent rally driven by fear in Europe over the banking sector will not continue past $1,350 and we will see the lows tested one more time before we see the Gold bull market start up again. We are witnessing the beginnings of the new gold bull market and clearly there is more upside now than downside. The previous two up-legs in gold gained 300% and 177%; the previous two up-legs in gold stocks (basis HUI) put on 1,300% and 325%. Over the next while, for those who are patient, GOLD is a buy.
There are various ways to get things started just call 03 5724 5100
Frank Holmes of US Global Investors is another who has forgotten more about the gold market
than many will ever know.
Here is his take on how far gold is off course:
Gold has been in extremely oversold territory lately despite drivers for the metal remaining in place.
Here’s a different way to look at how far gold has been off course. The chart below tracks the correlation of the price of an ounce of gold to global liquidity, with global liquidity defined as the sum of the U.S. monetary base and the foreign holdings of U.S. Treasuries. Since June 2000, as the U.S.’s monetary base and foreign holdings increased, so did the price of gold.

The correlation suggests the current level of liquidity supports a gold price of $1,780 per ounce, well above the current spot price around $1,300.
Source: US Global Investors
| We see two possible economic scenarios that could unfold going forward.
Goldilocks Scenario 1: Good economic news continues to come in, the stock markets’ recent rally continues. Talk of a double-dip recession recedes, the U.S. economy begins to recover further. Even Europe starts to look better. Abenomics works and Japan starts to grow. All looks great. The Federal Reserve’s efforts to save the U.S. economy and financial system succeed. So what happens next under this, albeit the least likely, scenario? The banks start lending more money … credit flows through the pipelines … and the trillions of paper dollars the Federal Reserve has created begin to work their way through the system. Normal credit creation fully resumes. So all the money created starts to be lent out and inflation begins to take hold in the USA and the rest of the world . . . Obviously, gold would soon bottom and start moving up again as it would be inflation and interest rate driven. (Remember gold rose in the 70’s with rising rates) Now consider … Scenario 2 (most likely): More bad economic news starts to come in … the U.S. economy goes from OK to so-so and it becomes painfully clear that governments’ and central banks’ rescue efforts have yet to work. In Europe and Japan economies slump further, and sovereign-debt defaults proceed across the globe. The interesting thing here is money will very likely flow into the USA markets as fear comes across Europe and Japan. Giving the illusion that the US is actually doing well — as it must be right, the US markets are going higher! You will see the US$ and gold rise at the same time. The US market will rise higher than many predict as it will be the last game in town. The Fed and other central banks pump trillions more dollars into their economies. But to no avail, because it also becomes painfully clear to almost everyone that countries are BANKRUPT. And so are their central banks. What happens under this scenario? All currencies dramatically lose purchasing power and the entire world plunges into a “greater” depression. The world’s monetary system is under huge pressure but, the sun still rises and life carries on. Physical gold and gold shares will protect those who have them. |
| FYI another 3+ tonnes was removed Friday (19thJuly) from the Comex “eligible” bin. This time for HSBC’s eligible inventory. Total gold on the Comex is now down to 6.8 million ounces. Note that this is “reported” gold stocks, for which the CME now uses a disclaimer in reporting the numbers. The total amount of gold futures open interest is now 47 times more than the registered gold (available for delivery gold) on the Comex. Those who are savvy are buying a lot of gold and taking possession. You have to buy physical gold and gold shares and take possession of it or else you don’t own gold.The Bottom Line
The reason we have seen such a big sell off in gold:
Medium to Long-term, with all the central banks printing full steam, gold will move higher. It is just a matter of time. So short term gold may still move lower, but in the medium to long-term we think you will see gold go a lot higher. The real bull market in gold will only begin once we have passed the 1980 inflation adjusted high: our guess is this will start to happen in 2015~ 2018. In either scenario gold will bottom soon (if not already) and head higher, for the simple reason that gold is insurance against a global economy that really has only two future scenarios right now, as laid out above. Our advice would be to hold and continue buying gold and gold miners, as gold starts a path higher toward a minimum target of $2,300 an ounce, the inflation-adjusted high that would be equivalent to what $850 gold was in February 1980. Investors all over the world are soon going to start loving gold, all over again. There will be shocks along the way: we may not have seen the low in this cycle yet but, the downside is now at worst around $1,000 for gold while the upside is beyond $3,000. Call us to discuss the differences in Gold ETFs and various mining shares and funds. |
This was all orchestrated to increase supply and tame demand. We believe that central planners are now running out of options to suppress the gold price. After taking a pause, the secular gold bull market is set to continue.
http://sprottglobal.com/markets-at-a-glance/maag-article/?id=8044
From Eric Sprott and David Baker of Sprott Asset Management
Do Western Central Banks Have Any Gold Left???
Somewhere deep in the bowels of the world’s Western central banks lie vaults holding gargantuan piles of physical gold bars… or at least that’s what they all claim. The gold bars are part of their respective foreign currency reserves, which include all the usual fiat currencies like the dollar, the pound, the yen and the euro.
Collectively, the governments/central banks of the United States, United Kingdom, Japan, Switzerland, Eurozone and the International Monetary Fund (IMF) are believed to hold an impressive 23,349 tonnes of gold in their respective reserves, representing more than $1.3 trillion at today’s gold price. Beyond the suggested tonnage, however, very little is actually known about the gold that makes up this massive stockpile. Western central banks disclose next to nothing about where it’s stored, in what form, or how much of the gold reserves are utilized for other purposes. We are assured that it’s all there, of course, but little effort has ever been made by the central banks to provide any details beyond the arbitrary references in their various financial reserve reports.
Twelve years ago, few would have cared what central banks did with their gold. Gold had suffered a twenty year bear cycle and didn’t engender much excitement at $255 per ounce. It made perfect sense for Western governments to lend out (or in the case of Canada – outright sell) their gold reserves in order to generate some interest income from their holdings. And that’s exactly what many central banks did from the late 1980’s through to the late 2000’s. The times have changed however, and today it absolutely does matter what they’re doing with their reserves, and where the reserves are actually held. Why? Because the countries in question are now all grossly over-indebted and printing their respective currencies with reckless abandon. It would be reassuring to know that they still have some of the ‘barbarous relic’ kicking around, collecting dust, just in case their experiment with collusive monetary accommodation doesn’t work out as planned.
You may be interested to know that central bank gold sales were actually the crux of the original investment thesis that first got us interested in the gold space back in 2000. We were introduced to it through the work of Frank Veneroso, who published an outstanding report on the gold market in 1998 aptly titled, “The 1998 Gold Book Annual”. In it, Mr. Veneroso inferred that central bank gold sales had artificially suppressed the full extent of gold demand to the tune of approximately 1,600 tonnes per year (in an approximately 4,000 tonne market of annual supply). Of the 35,000 tonnes that the central banks were officially stated to own at the time, Mr. Veneroso estimated that they were already down to 18,000 tonnes of actual physical. Once the central banks ran out of gold to sell, he surmised, the gold market would be poised for a powerful bull market… and he turned out to be completely right – although central banks did continue to be net sellers of gold for many years to come.
As the gold bull market developed throughout the 2000’s, central banks didn’t become net buyers of physical gold until 2009, which coincided with gold’s final break-out above US$1,000 per ounce. The entirety of this buying was performed by central banks in the non-Western world, however, by countries like Russia, Turkey, Kazakhstan, Ukraine and the Philippines… and they have continued buying gold ever since. According to Thomson Reuters GFMS, a precious metals research agency, non-Western central banks purchased 457 tonnes of gold in 2011, and are expected to purchase another 493 tonnes of gold this year as they expand their reserves.1 Our estimates suggest they will likely purchase even more than that.2 The Western central banks, meanwhile, have essentially remained silent on the topic of gold, and have not publicly disclosed any sales or purchases of gold at all over the past three years. Although there is a “Central Bank Gold Agreement” currently in place that covers the gold sales of the Eurosystem central banks, Sweden and Switzerland, there has been no mention of gold sales by the very entities that are purported to own the largest stockpiles of the precious metal.3 The silence is telling.
Over the past several years, we’ve collected data on physical demand for gold as it has developed over time. The consistent annual growth in demand for physical gold bullion has increasingly puzzled us with regard to supply. Global annual gold mine supply ex Russia and China (who do not export domestic production) is actually lower than it was in year 2000, and ever since the IMF announced the completion of its sale of 403 tonnes of gold in December 2010, there hasn’t been any large, publicly-disclosed seller of physical gold in the market for almost two years.4 Given the significant increase in physical demand that we’ve seen over the past decade, particularly from buyers in Asia, it suffices to say that we cannot identify where all the gold is coming from to supply it… but it has to be coming from somewhere.
To give you a sense of how much the demand for physical gold has increased over the past decade, we’ve listed a select number of physical gold buyers and calculated their net change in annual demand in tonnes from 2000 to 2012 (see Chart A).
CHART A 
Numbers quoted in metric tonnes. † Source: CBGA1, CBGA2, CBGA3, International Monetary Fund Statistics, Sprott Estimates. †† Source: Royal Canadian Mint and United States Mint. ††† Includes closed-end funds such as Sprott Physical Gold Trust and Central Fund of Canada. ^ Source: World Gold Council, Sprott Estimates. ^^ Source: World Gold Council, Sprott Estimates. ^^^ Refers to annualized increase over the past eight years.
As can be seen, the mere combination of only five separate sources of demand results in a 2,268 tonne net change in physical demand for gold over the past twelve years – meaning that there is roughly 2,268 tonnes of new annual demand today that didn’t exist 12 years ago. According to the CPM Group, one of the main purveyors of gold statistics, the total annual gold supply is estimated to be roughly 3,700 tonnes of gold this year. Of that, the World Gold Council estimates that only 2,687 tonnes are expected to come from actual mine production, while the rest is attributed to recycled scrap gold, mainly from old jewelry.5 (See footnote 5). The reporting agencies have a tendency to insist that total physical demand perfectly matches physical supply every year, and use the “Net Private Investment” as a plug to shore up the difference between the demand they attribute to industry, jewelry and ‘official transactions’ by central banks versus their annual supply estimate (which is relatively verifiable). Their “Net Private Investment” figures are implied, however, and do not measure the actual investment demand purchases that take place every year. If more accurate data was ever incorporated into their market summary for demand, it would reveal a huge discrepancy, with the demand side vastly exceeding their estimation of annual supply. In fact, we know it would exceed it based purely on China’s Hong Kong gold imports, which are now up to 458 tonnes year-to-date as of July, representing a 367% increase over its purchases during the same period last year. If the imports continue at their current rate, China will reach 785 tonnes of gold imports by year-end. That’s 785 tonnes in a market that’s only expected to produce roughly 2,700 tonnes of mine supply, and that’s just one buyer.
Then there are all the private buyers whose purchases go unreported and unacknowledged, like that of Greenlight Capital, the hedge fund managed by David Einhorn, that is reported to have purchased $500 million worth of physical gold starting in 2009. Or the $1 billion of physical gold purchased by the University of Texas Investment Management Co. in April 2011… or the myriad of other private investors (like Saudi Sheiks, Russian billionaires, this writer, probably many of our readers, etc.) who have purchased physical gold for their accounts over the past decade. None of these private purchases are ever considered in the research agencies’ summaries for investment demand, and yet these are real purchases of physical gold, not ETF’s or gold ‘certificates’. They require real, physical gold bars to be delivered to the buyer. So once we acknowledge how big the discrepancy is between the actual true level of physical gold demand versus the annual “supply”, the obvious questions present themselves: who are the sellers delivering the gold to match the enormous increase in physical demand? What entities are releasing physical gold onto the market without reporting it? Where is all the gold coming from?
There is only one possible candidate: the Western central banks. It may very well be that a large portion of physical gold currently flowing to new buyers is actually coming from the Western central banks themselves. They are the only holders of physical gold who are capable of supplying gold in a quantity and manner that cannot be readily tracked. They are also the very entities whose actions have driven investors back into gold in the first place. Gold is, after all, a hedge against their collective irresponsibility – and they have showcased their capacity in that regard quite enthusiastically over the past decade, especially since 2008.
If the Western central banks are indeed leasing out their physical reserves, they would not actually have to disclose the specific amounts of gold that leave their respective vaults. According to a document on the European Central Bank’s (ECB) website regarding the statistical treatment of the Eurosystem’s International Reserves, current reporting guidelines do not require central banks to differentiate between gold owned outright versus gold lent out or swapped with another party. The document states that, “reversible transactions in gold do not have any effect on the level of monetary gold regardless of the type of transaction (i.e. gold swaps, repos, deposits or loans), in line with the recommendations contained in the IMF guidelines.”6 (Emphasis theirs). Under current reporting guidelines, therefore, central banks are permitted to continue carrying the entry of physical gold on their balance sheet even if they’ve swapped it or lent it out entirely. You can see this in the way Western central banks refer to their gold reserves. The UK Government, for example, refers to its gold allocation as, “Gold (incl. gold swapped or on loan)”. That’s the verbatim phrase they use in their official statement. Same goes for the US Treasury and the ECB, which report their gold holdings as “Gold (including gold deposits and, if appropriate, gold swapped)” and “Gold (including gold deposits and gold swapped)”, respectively (see Chart B). Unfortunately, that’s as far as their description goes, as each institution does not break down what percentage of their stated gold reserves are held in physical, versus what percentage has been loaned out or swapped for something else. The fact that they do not differentiate between the two is astounding, (Ed. As is the “including gold deposits” verbiage that they use – what else is “gold” supposed to refer to?) but at the same time not at all surprising. It would not lend much credence to central bank credibility if they admitted they were leasing their gold reserves to ‘bullion bank’ intermediaries who were then turning around and selling their gold to China, for example. But the numbers strongly suggest that that is exactly what has happened. The central banks’ gold is likely gone, and the bullion banks that sold it have no realistic chance of getting it back.
CHART B 
Sources: 1) http://www.bankofengland.co.uk/statistics/Documents/reserves/2012/Aug/tempoutput.pdf 2) http://www.treasury.gov/resource-center/data-chart-center/IR-Position/Pages/08312012.aspx 3) http://www.ecb.int/stats/external/reserves/html/assets_8.812.E.en.html 4) http://www.boj.or.jp/en/about/account/zai1205a.pdf 5) http://www.imf.org/external/np/exr/facts/gold.htm 6) http://www.snb.ch/en/mmr/reference/annrep_2011_komplett/source
Notes: ECB Data as of July 2012. Bank of Japan data as of March 31, 2012.
* European Central Bank reserves is composed of reserves held by the ECB, Belgium, Germany, Estonia, Ireland, Greece, Spain, France, Italy, Cyprus, Luxembourg, Malta, The Netherlands, Austria, Portugal, Slovenia, Slovakia and Finland. ** Bank of Japan only lists its gold reserves in Yen at book value.
Our analysis of the physical gold market shows that central banks have most likely been a massive unreported supplier of physical gold, and strongly implies that their gold reserves are negligible today. If Frank Veneroso’s conclusions were even close to accurate back in 1998 (and we believe they were), when coupled with the 2,300 tonne net change in annual demand we can easily identify above, it can only lead to the conclusion that a large portion of the Western central banks’ stated 23,000 tonnes of gold reserves are merely a paper entry on their balance sheets – completely un-backed by anything tangible other than an IOU from whatever counterparty leased it from them in years past. At this stage of the game, we don’t believe these central banks will be able to get their gold back without extreme difficulty, especially if it turns out the gold has left their countries entirely. We can also only wonder how much gold within the central bank system has been ‘rehypothecated’ in the process, since the central banks in question seem so reluctant to divulge any meaningful details on their reserves in a way that would shed light on the various “swaps” and “loans” they imply to be participating in. We might also suggest that if a proper audit of Western central bank gold reserves was ever launched, as per Ron Paul’s recent proposal to audit the US Federal Reserve, the proverbial cat would be let out of the bag – with explosive implications for the gold price.
Notwithstanding the recent conversions of PIMCO’s Bill Gross, Bridegwater’s Ray Dalio and Ned Davis Research to gold, we realize that many mainstream institutional investors still continue to struggle with the topic. We also realize that some readers may scoff at any analysis of the gold market that hints at “conspiracy”. We’re not talking about conspiracy here however, we’re talking about stupidity. After all, Western central banks are probably under the impression that the gold they’ve swapped and/or lent out is still legally theirs, which technically it may be. But if what we are proposing turns out to be true, and those reserves are not physically theirs; not physically in their possession… then all bets are off regarding the future of our monetary system. As a general rule of common sense, when one embarks on an unlimited quantitative easing program targeted at the employment rate (see QE3), one had better make sure to have something in the vault as backup in case the ‘unlimited’ part actually ends up really meaning unlimited. We hope that it does not, for the sake of our monetary system, but given our analysis of the physical gold market, we’ll stick with our gold bars and take comfort as they collect more dust in our vaults, untouched.
| 1 | http://www.bloomberg.com/news/2012-09-04/central-bank-gold-buying-seen-reaching-493-tons-in-2012-by-gfms.html |
| 2 | See notes in Chart A. |
| 3 | http://www.gold.org/government_affairs/reserve_asset_management/central_bank_gold_agreements/ |
| 4 | http://www.imf.org/external/np/exr/faq/goldfaqs.htm |
| 5 | Mine supply estimate supplied by World Gold Council; YTD gold mine production data suggests that total 2012 gold mine supply will come in lower around 2,300 tonnes, ex Russia and China production. In addition, Frank Veneroso has recently published a new report that warns that the supply of recycled scrap gold could drop significantly going forward due to the depletion ofthe inventories of industrial scrap and long held jewelry over the past decade. |
| 6 | http://www.ecb.int/pub/pdf/other/statintreservesen.pdf |
Part 2
Do Western Central Banks Have Any Gold Left? Part II (part 1 here)
The past few months have been difficult for the gold investor as selling pressure in the gold futures market has set a decidedly negative direction for the price of the yellow metal. As fundamental investors, we always pay special attention to the supply and demand dynamics of gold and, recently, we have found it very difficult to reconcile lower prices with continued strong demand for physical gold.
While the supply of gold has remained largely static, we have seen a steady increase in demand for the yellow metal. India and China have emerged as strong buyers, consuming over half of the mine supply in recent years. Central banks have switched from being sellers of gold to being net buyers, with their gold purchases in 2012 increasing by 17% to almost 535 tonnes. Exchange traded products (ETPs) around the world have continued to add to their gold hoards, as have institutions and private investors. Furthermore, central banks, such as South Korea and Russia, have added to their bullion reserves early in 2013, which points to sustained strength in demand. These facts are important because, over the past decade, the annual supply of gold has stayed flat at approximately 4,000 tonnes.
Much ado has been made about the recent sell-off in the yellow metal forcing certain ETPs to liquidate, adding a supply of gold into the market in the process. Our work reveals that the previous ETP sell-offs, (which occurred in January 2011, December 2011, May 2012 and July 2012) have all coincided with gold finding strong price support and rallying higher.
In our September 2012 MAAG, titled, “Do Western Central Banks Have Any Gold Left???”, we reconciled the annual change in demand for gold between 2000 and 2012 to be almost 2,300 tonnes. We went on to hypothesize that given the massive change in demand, the only suppliers large enough to fill the gap between supply and demand were the Central Banks. Now, our long search for the “smoking gun” to prove our hypothesis appears to have finally materialized.
Every month, the US Census Bureau releases the FT900 document, which outlines US International Trade Data. Going through this document, we were intrigued to see that in December 2012 the US exported over $4B worth of gold and imported around $1.5B worth of gold, representing a net export of $2.5B or almost 50 tonnes1. This surprising number led us to look at the previous releases of US International Trade Data which go as far back as 1991 – what we found was truly shocking. Not only has the US been consistently exporting large quantities of gold on a net basis, the amount of gold the US has been exporting is above and beyond what the US should be capable of exporting.
The gold market is fairly simple to understand from a supply and demand perspective. Since you cannot fabricate gold out of thin air, supply comes from new mine production, scrap gold recycling and investor disposition of bullion. Demand comes from many sources including investment demand, electronics, dental and industrial uses to name a few. There can be short-term aberrations between supply and demand where the market can be oversupplied, or demand can outstrip supply, however, over a longer period, supply should equal demand with the price acting as the equalizer. Under this assumption, the amount of gold that the US is exporting should equate to the amount of gold that the US is not consuming over a long enough time frame.
Table 1 lays out our framework for analyzing the US gold supply and demand.
Table 1 
For our analysis of supply and demand, we have very robust statistics as far as mine production, import-export data, coin sales and ETP demand from GFMS2, the US Census Bureau3, the US Mint4 and Bloomberg5, respectively. We have good data on gold recycling, jewelry sales and gold use in electronics and industrial applications from the CPM Group6.
Table 2 lays out our analysis for 2012 using the supply and demand framework.
Table 2 
We used this framework to analyze supply and demand in the US going all the way back to 1991, which is as far back as the FT900 documents go. Over the span of 22 years, the total amount of gold that the US has exported – above and beyond its supply capability – is almost 4,500 tonnes! A truly stunning figure. (See Table 3).
TABLE 3: US GOLD MARKET, CUMULATIVE SUPPLY DEMAND 1991-2012 (IN TONNES) 

Admittedly there is an unknown in our analysis, that being gold bullion acquisition and disposition by private investors. However, strong demand in ETPs such as GLD and PHYS and demand for gold coins provide strong evidence that the private investor has been a net buyer over the years. The inclusion of the private investor on the demand side would in fact skew the ‘gap’ of 4,500 tonnes higher to a figure that would lie somewhere between 4,500 tonnes and 11,200 tonnes, which represents the gross exports out of the US. The only US seller that would be capable of supplying such an astonishing amount of gold is the US Government, with a reported gold holding of 8,300 tonnes. The US Government gold holdings have not been audited or verified in more than four decades. The US trade data defines the export of nonmonetary gold as a sale of gold from a private seller within the US to an official agency. In September 2012, we espoused that the Western Central Banks have been surreptitiously selling/ leasing their gold through private channels in an effort to increase the available supply and in turn suppress prices. This new analysis using official US agency numbers seems to provide the strongest validation of our hypothesis to date. It is worth noting that our data only covers two decades and that the export ‘gap’ could in fact be significantly larger if earlier numbers were included or the real private investor demand for gold was known.
We are currently in an environment where policy makers are intent on devaluing their currencies in an effort to create growth. Real rates continue to stay negative in most of the developed world. Every marginal dollar of debt that is created is producing lower and lower amounts of growth. In a world overwhelmed by mountains of debt and economic growth which is sub-par at best, precious metals and real assets can act as insurance against the stupidity of policy makers. The evidence pointing towards the suppression of the gold price is becoming increasingly apparent. Don’t be the last person to figure this out! The current sell-off in gold should be viewed not with extreme trepidation but as an unbelievable opportunity to buy the metal at an artificially low value.
| 1 | Import Export Stats – US Census Foreign trade: http://www.census.gov/foreign-trade/index.html |
| 2 | GFMS – http://www.gfms.co.uk/ |
| 3 | Import Export Stats – US Census Foreign trade: http://www.census.gov/foreign-trade/index.html |
| 4 | Coin sales from US Mint: http://www.usmint.gov/ |
| 5 | Bloomberg |
| 6 | Jewelry, recycling, dental, electronics and industrial from CPM Gold Yearbook |
http://media.chicagobooth.edu/mediasite/Viewer/?peid=f15d95d054e8442ab0cc1c60321383101d
Kyle Bass, addressing Chicago Booth’s Initiative on Global Markets last week, clarified his thesis on Japan in great detail, but it was the Q&A that has roused great concern. “The AIG of the world is back – I have 27 year old kids selling me one-year jump risk on Japan for less than 1bp – $5bn at a time… and it is happening in size.” As he explains, the regulatory capital hit for the bank is zero (hence as great a return on capital as one can imagine) and “if the bell tolls at the end of the year, the 27-year-old kid gets a bonus… and if he blows the bank to smithereens, ugh, he got a paycheck all year.” Critically, the bank that he bought the ‘cheap options’ from recently called to ask if he would close the position – “that happened to me before,” he warns, “in 2007 right before mortgages cracked.” His single best investment idea for the next ten years is, “Sell JPY, Buy Gold, and go to sleep,” as he warns of the current situation in markets, “we are right back there! The brevity of financial memory is about two years.”
An excellent post from Jeff Clark at Casey research on gold and history. We strongly agree and as stated earlier feel now is the time to accumulate gold as there will be a significant rise in prices going forward we see all-time highs broken in 2015 or earlier.
Gold Is Over – Just Like in 1976
By Jeff Clark, Senior Precious Metals Analyst
Goldman Sachs has lowered its gold price projections and says the metal is headed to $1,200. Credit Suisse and UBS are bearish. Citigroup says the gold bull market is over.
So I guess it’s time to pack it in, right?
Not so fast. As we’ve written before, these types of analysts have been consistently wrong about gold throughout this bull cycle. Another reason to disagree, however, is history; we’ve seen this movie before. In the middle of one of the greatest gold bull markets in modern history – the one that culminated in the 1980 peak – gold experienced a 20-month, one-way decline. Every time it seemed to stabilize, the bottom would fall out again. From December 30, 1974 to August 25, 1976, gold fell a whopping 47%.
1976 had to be a tough year for gold investors. The price had already been declining for a year – and it just kept on sinking. Since that’s similar to what we’re experiencing today, I wondered, What were the pundits were saying then? I wanted to find out.
I enlisted the help of two local librarians, along with my wife and son, to dig up some quotes from that year. It wasn’t easy, because publications weren’t in digital form yet, and electronic searches had limited success. But we did uncover some nuggets I thought you might find interesting.
The context for that year is that the IMF had three major gold auctions from June to September, dumping a lot of gold onto the market. Both the US and the Soviet Union were also selling gold at the time. It was no secret that the US was trying to remove gold from the monetary system; direct convertibility of the dollar to gold had ended on August 15, 1971.
The public statements below were all made in 1976. You’ll see that they aren’t all necessarily bearish, but I included a range to give a sense of what was happening at the time, especially regarding the mood of the gold market. I think you’ll agree that much of this sounds awfully darn familiar. I couldn’t resist making a few comments of my own, too.
To highlight the timing, I put the comments into a price chart, pinpointing when they were said relative to the market. Keep in mind as you read them that the gold price bottomed on August 25, and then began a three-and-a-half year, 721% climb…

(Click on image to enlarge)
[1] “For the moment at least, the party seems to be over.” New York Times, March 26.
[2] “Though happily out of the precious metal, Mr. Heim is no more bullish on the present state of the stock market than any of the unreconstructed gold bugs he’s had so much fun twitting of late. He’s urging his clients to put their money into Treasury bills.” New York Times, March 26.
Me: These comments remind me of those today who poke fun at gold investors. I wonder if Mr. Heim was still “twitting” a couple years later?
[3] “‘It’s a seller’s market. No one is buying gold,’ a dealer in Zurich said.” New York Times, July 20.
Turns out this would’ve been an incredible buyer’s market – but only for those with the courage to buy more when gold dropped still lower before taking off again.
[4] “Though the price recovered to $111 by week’s end, that is still a dismal figure for gold bugs, who not long ago were forecasting prices of $300 or more.” Time magazine, August 2.
The “gold bugs” were eventually right; gold hit $300 almost exactly three years later, a 170% rise.
[5] “Meanwhile, the economic conditions that triggered the gold boom of 1973 through 1974, have largely disappeared. The dollar is steady, world inflation rates have come down, and the general panic set off by the oil crisis has abated. All those trends reduce the distrust of paper money that moves many speculators to put their funds in gold.” Time magazine, August 2.
This view ended up being shortsighted, as these conditions all reversed before the decade was over. Does this sound similar to pundits today claiming the reasons for buying gold have disappeared?
[6] “Our own predictions are that gold will go below $100, with some hesitation possible at the $100 level.” As stated by Mr. Heim in the August 19 New York Times.
Yes, this is the same gentleman as #2 above. I wonder how many of his clients were still with him a few years later?
[7] “Currently, Mr. LaLoggia has this to say: ‘There is simply nothing in the economic picture today to cause a rush into gold. The technical damage caused by the decline is enormous and it cannot be erased quickly. Avoid gold and gold stocks.'” New York Times, August 19.
You can see that these comments were made literally within days of the bottom! Take note, technical analysts.
[8] “‘Gold was an inflation hedge in the early 1970s,’ the Citibank letter says. ‘But money is now a gold-price hedge.'” New York Times, August 29.
Wow, were they kidding?! This reminds me of those dimwits journalists who said in 2011 to not invest in gold because it isn’t “backed by anything.”
[9] “Private American purchases of gold, once this was legalized at the end of 1974, never materialized on a large scale. If the gold bugs have indeed been routed, special responsibilities fall on the victorious dollar.” New York Times, August 29.
The USD’s purchasing power has declined by 80% since this article declared the dollar “victorious.”
[10] “Some experts, with good records in gold trading, declare it is still too early to buy bullion.”New York Times, September 12.
Too bad; they could’ve cleaned up.
[11] “Wall Street’s biggest brokerage houses, after having scorned gold investments during the bargain days of the late 1960s and early 1970s, made a great display of arriving late at the party.” New York Times, September 12.
No comment necessary.
[12] “He believes the price of bullion is headed below $100 an ounce. ‘Who wants to put money over there now?'” As stated by Lawrence Helm in the New York Times, September 12.
The price of gold had bottomed two weeks before, making the timing of this advice about the worst it could possibly be.
[13] Author Elliot Janeway, whose book jacket states, “Presidents listen to him,” was asked by a book reviewer about his preferred investments. He writes: “Then, gold and silver? He likes neither. In fact he writes: ‘Any argument against putting your trust in gold, and backing it up with money, goes double for silver: silver is fool’s gold.'” New York Times, November 21.
Mr. Janeway ate his words big-time: from the date of his comments to silver’s peak of $50 on January 21, 1980, silver rose 1,055%!
[14] “Mr. Holt admits that ‘in 1974, intense speculation caused the gold price to get too far ahead of itself.'” New York Times, December 19.
So, anything sound familiar here? Yes, it was a brutal time for gold investors, but what’s obvious is that those who looked only at the price and ignored the fundamentals ended up eating their words and dispensing horrible advice. Investors who followed the “wisdom of the day” missed out on one of the greatest opportunities for profit in their lifetimes.
I was pleased to learn, though, that not all comments were negative in 1976. In fact, in the middle of the “great selloff,” there were those who remained stanchly bullish. These investors must’ve been viewed as outliers – they, much like some of us now, were the contrarians of the day.
Also from 1976…
It’s clear that there were positive “voices in the wilderness” during that big correction, and as we all know, those who listened profited mightily.
There were other interesting tidbits, too. For example, gold stocks had been performing so poorly for so long that some advisors suggested a strategy we also hear today…
Even back then, it was widely known that gold often bucks the trend of the broader markets…
Gold miners provided critical revenue and jobs, just like today. From the August 2 issue of Timemagazine…
Gold was also used as collateral…
And just like today, there were plenty of stupid misguided US politicians: From the New York Timeson August 27:
That last statement from the Swiss bankers is hauntingly just as true today.
Last, you know how the government in India has been tinkering with the precious-metals market in its country? And how it’s led to smuggling? From the New York Times on August 27:
So what’s the difference in mood today vs. the mid-1970s? Nothing! This shows that the same concerns, fears, and confusion we have now existed at a similar point in the gold market then. There were also those who saw the big picture and stayed vigilant. Virtually every comment made in 1976 could apply to today. Keep in mind that most of the statements above are from two publications only; there are undoubtedly many more similar comments from that year.
The obvious lesson here is that patience won out in the end. It took the gold price three years and seven months to return to its December 1974 high. It only took another 18 months to soar to $850. Today, that would be the equivalent of gold falling until June this year, and not returning to its $1,921 high until April, 2015. It would also mean we climb to $6,227 and get there in November, 2016. Could you wait that long for a fourfold return?
This review of history gives us the confidence to know that our gold investments are on the right track. I hope you’ll join me and everyone else at Casey Research in accepting this message from history and staying the course.
So, what will your kids or grandkids read in a few decades?

