There is an old saying on Wall Street that the market is driven by just two emotions: FEAR and GREED. Although this is an oversimplification, it can often be true. Succumbing to these emotions can have a profound and detrimental effect on investors’ portfolios and stock markets worldwide.
Warren Buffet is a great example of how to avoid these two emotions in our investing decisions and has two great quotes regarding this topic that I think are very appropriate, given our current market conditions.
The first quote goes like this: “Unless you can watch your stock holdings decline by 50% without becoming panic-stricken, you should not be in the stock market.”
And the second one:“We simply attempt to be fearful when others are greedy and to be greedy only when others are fearful.”
Deflation Next?
One of the concerns of both the financial markets and the Fed is the prospect for near term deflation in the economy. Deflation can occur when consumers begin to forgo current consumption due to their expectation that prices will fall in the future. This in turn can lead to lower investment by companies that refuse to commit capital to their businesses because of their expectation of a low rate of return due to lower prices. This creates a vicious cycle of both falling consumption and falling investment known as the “deflationary spiral.” This cycle can become very difficult to break out of once it takes hold, as evidenced by Japan in the ‘90s. The Fed clearly understands this and the potential downside risks of deflation. In addition, the market will begin to look for signs of deflation and will anticipate steps that the Fed will need to take in order to prevent it. This, we believe, is one of the reasons why the U.S. Treasury market has rallied so strongly and will continue to do so in the near term. While the initial move in May could be attributed to a short term flight to quality, the most recent move lower in yields appears more long term in nature. One explanation for this is that the market is becoming aware that the economy may be entering a deflationary spiral and that the Fed may move long term rates lower through additional Quantitative Easing (“QE”). Since short term rates are already hovering near zero, QE is one of the few mechanisms left that will allow the Fed to provide further monetary stimulus.
Global Warming
NASA has found that methane is 33 times more potent than carbon dioxide in causing global warming.
Many scientists have said that methane releases have caused past warming spells. See this, this, this, this and this. Indeed, methane has such a powerful effect on climate that scientists believe that woolly mammoth farts gaseous emissions are responsible for warming the Earth 13,000 years ago.
Guess what is streaming into the Gulf of Mexico along with the OIL. . . Tremendous quantities of methane are being emitted by the Gulf oil spill. The methane could kill all life in large areas of the Gulf. However, rumors being spread widely around the Web claiming that the methane could bring on a doomsday catastrophe are not credible.
Yet . . only time will tell.
 if you have Yen sitting in the bank, it is time to move and take advantage of the current exchange rate . . . call 03 5724 5100 we can help.
The market in quick format:
Gold ETF GLD – Daily Chart
Gold has formed a large cup & handle pattern. It has held up well during the recent weakness.
But zooming into the intraday charts I do have some concerns about a sharp sell-off in the very near future.
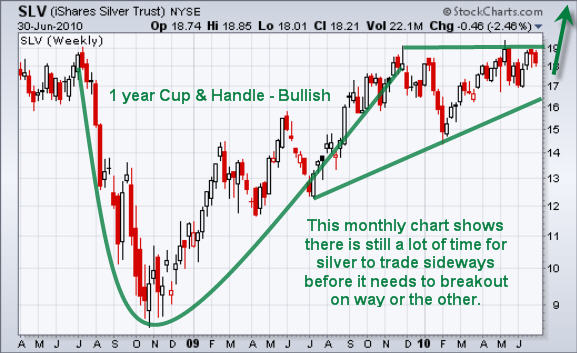
Silver ETF SLV – Weekly Chart
This is a weekly chart and goes all the way back to 2008 showing a very large cup & Handle. We could technically still see silver trade sideways for several months before it reaches the apex and is forced to breakout in either direction. The upside potential for a cup and handle pattern is 100- 300% of the height of the cup. So this means $1450 gold and $29 silver using the minimum potential.
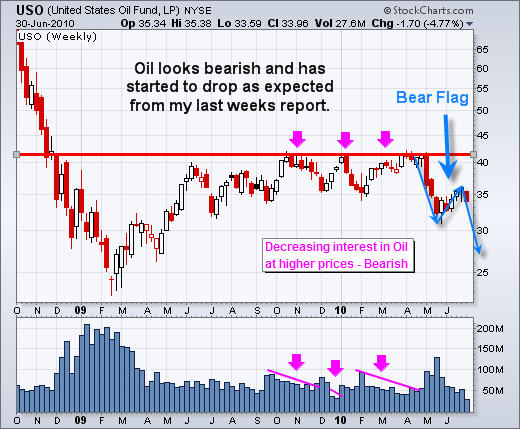
Crude Oil Fund – Weekly Chart
Oil formed a triple top over the past 10 months and has started to head south. We have seen selling volume drop during the test of resistance which is not a good thing.
SP500 ETF SPY – Weekly Chart
The SP500 along with several other indexes have formed a head & shoulders patter and appear to be in the process of breaking down through the necklines. If this unfolds then we are looking at much lower prices for stocks.
Get in touch if you have any questions 03 5724 5100
Ever Wonder…
Why the sun lightens our hair, but darkens our skin? Why is lemon juice made with artificial flavor, and dishwashing liquid made with real lemons? Why is the time of day with the slowest traffic called rush hour? Why is it that doctors call what they do “practice”? Why don’t sheep shrink when it rains? Why isn’t there mouse-flavored cat food? Why are they called apartments when they are all stuck together? If con is the opposite of pro, is Congress the opposite of progress? If flying is so safe, why do they call the airport the terminal?


