May Finance in Focus

Posted on 27th April 2010 by Trevor in Finance in Focus

With Complacency Comes Danger 

It is a measure of the powerful positive sentiment currently driving the market that each successive concern is readily dismissed. Dubai World debt problems? They are rich, they can cover it. Greek debt? It is a small country, someone will bail them out. Breakdown of the Euro zone? It will probably be better to lose a few countries anyway. China property bubble? The authorities can contain it. And Goldman Sachs malfeasance? Well, that is probably the least surprising and least concerning of the lot, assuming you do not own GS stock! 

But all these issues have one thing in common. They are the result of excessive debt and leverage. Debt is useful and productive up until a point. As long as the underlying asset generates enough cash flow to service and gradually pay down the debt, all is well. But when the underlying asset suffers a decline in cash flow, the party is over. Debt servicing becomes harder and default eventually occurs. 

Governments around the world realize this and they have (so far) offset the effect of contracting private credit by running huge budget deficits. Ironically enough, equity markets are the main beneficiary of the increase in government debt so it is no surprise that investors are showing no signs of concern. The International Monetary Fund (IMF) is not so sanguine though. In it’s just released Global Financial Stability Report the IMF asks, could Sovereign Risks Extend the Global Credit Crisis’. 

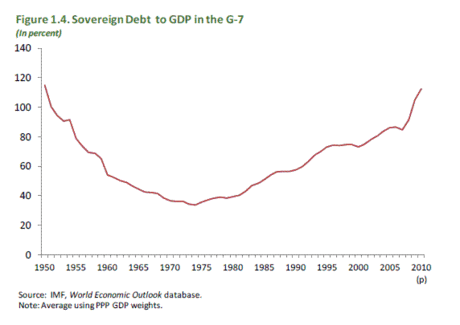
“The crisis has increased sovereign risks and exposed underlying vulnerabilities. The higher budget deficits resulting from the crisis have pushed up sovereign indebtedness, while lower potential growth has worsened debt dynamics. For example, G-7 sovereign debt levels as a proportion of GDP are nearing 60-year highs. Higher debt levels have the potential for spillovers across financial systems, and to impact on financial stability.” 

The chart below shows G7 sovereign debt levels as a proportion of GDP. Note the spike higher from 2007/08. Now, many will look at this chart and say so what, we have been here before. While that is certainly the case, there is one crucial difference. In the 1950s and 1960s debt levels were falling from the excessive levels built up during the aftermath of the depression and the Second World War. On the plus side, private debt levels were tiny and as nations recovered from the Depression and war, increased credit flowed to the private sector. 

More to the point, most of the increased credit was used for productive purposes. Banks hadn’t invented mortgage equity withdrawals or subprime loans yet, so loans tended to be for production rather than consumption. It is not surprising therefore that the US golden period was during the 50s and 60s. 

But the global economy is now in a position of high government AND high private sector indebtedness. Because governments are quite good at spending other people’s money, we expect the sovereign debt ratio to go much higher in the years ahead as an offset to contracting private sector credit. But like other concerns before it, equity markets around the world just don’t seem all that worried by 50 year high government debt levels. Nor does the bond market for that matter. In our experience, investors don’t care about such trivial things as housing bubbles, sovereign debt defaults, or currency breakdowns until they have to.   Source: Sound Money. Sound Investments.com

We strongly believe caution is warranted.

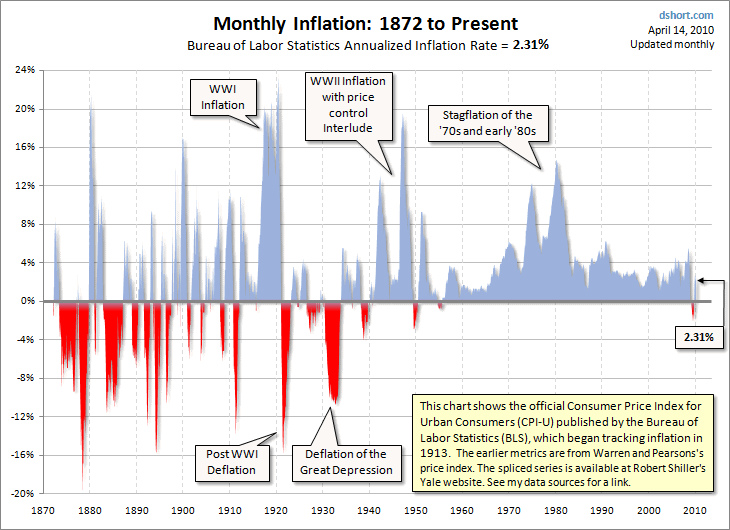
Are we in Deflation or Inflation?  

 The Bond Markets tell us Inflation is dead there are numerous articles telling us so, even Ben Bernanke!  It must be true!

 So what should you do – conventional wisdom says this:

Investment Themes For Deflation

  • In deflation, debt is the enemy.
  • Risk is to be avoided.
  • Cash is raised.
  • Treasuries are sought out as a safe haven
  • CD ladders offer a good investment structure.
  • Gold, acting as money does well.
  • Select equity shorts or Puts are a standout.
  • Renting as opposed to owning a house should be considered.
  • Currency plays.

 Investment Themes For inflation

In inflation the last place one wants to be is in cash.

  • Commodities in general are a standout.
  • Gold is a standout.
  • Precious metals are a standout.
  • Property is a winner.
  • Equities are a winner.
  • Treasuries are distinct losers if not outright shorts.
  • Foreign currencies
  • Energy a winner

Looking at the above two scenarios we have bits of each doing well.

Deflation in economics is a persistent decrease in the general price level of goods and services, when inflation is below zero percent, resulting in an increase in the real value of money – a negative inflation rate. When the inflation rate slows down (decreases, but remains positive), this is known as disinflation.

Inflation destroys real value in money. Deflation creates real value in money. Alternatively, the term deflation was used by the classical economists to refer to a decrease in the money supply and credit; some economists, including many Austrian school economists, still use the word in this sense. The two meanings are closely related, since a decrease in the money supply is likely to cause a decrease in the price level.

Deflation is considered a problem in a modern economy because of the potential of a deflationary spiral and its association with the Great Depression, although not all episodes of deflation correspond to periods of poor economic growth historically.

Disinflation is a decrease in the rate of inflation. This phase of the business cycle, in which retailers can no longer pass on higher prices to their customers, often occurs during a recession. In contrast, deflation occurs when prices are actually dropping.

To fully understand disinflation we need to first understand inflation. The word inflation originally meant an increase in the supply of money which resulted in an increase in prices. But, in more recent years, the word inflation has come to mean the result rather than the cause. i.e. an increase in prices rather than an increase in the supply of money. This might be partially the result of the wide spread usage of the term “inflation rate” which measures the rate of price increases rather than the increase in the money supply.

Disinflation on the other hand is a more recent term and so only has the connotation of moderating prices i.e. prices that are not increasing as quickly as they once did. For example if the annual inflation rate one month is 5% and it is 4% the following month, prices disinflated by 1% but are still increasing at a 4% annual rate.

If available money to spend indeed contracted, then the deflationists are right about seeing deflation in 2008.  But if the money supply fell by less than stocks and commodities plunged, was flat, or even grew, then deflationists are wrong.  When prices fall simply because demand declines (too much fear to buy anything immediately), this is merely supply and demand.  If money didn’t drive it, then it isn’t deflation.

Since the commodities slide started in July 2008, annual MZM growth on a weekly basis has averaged 11.6%.  It never shrunk!  If the broad US money supply always grew by at least 9% over the period of these sharply lower prices the deflationists cite, and averaged 12% to 13%, then how on earth could the stock slide or commodities slide be deflationary?  Prices didn’t fall because there was less money available to spend on stocks and commodities, but because demand plunged relative to supply.

Deflation is exclusively monetary in nature.  And since mid-2007 when the general credit crunch started unfolding, the Fed has grown broad money by the fastest annual rates seen since the aftermath of the 9/11 terrorist attacks.  This fact is indisputable.  Without a shrinking money supply, negative growth rates, there is no basis for declaring deflation.  Redefining “deflation” to mean something it is not doesn’t make it so.

AS a result we think INFLATION is coming . . . 

Inflation is Dead – what utter hooey.

The Alternate CPI puts the annualized inflation rate at 9.47%. (Data from www.shadowstats.com).

For a fascinating perspective on inflation and the adjustments to the official calculation method, watch this from Chris Martenson.

Now when you consider the inflation figures Washington puts out each month, the March’s Consumer Price Index (CPI) data; the “core” inflation rate rose a modest 0.1%. So every politician and most of Wall Street analysts point to it and proclaim that inflation is dead.

Inflation? “Not a problem” … “tame” … “easy to deal with” — those were some of the comments and headlines that came out after the figure was released.

I disagree just have a look at what is happening around you – what is cheaper than last year?

Here are just a few examples … of everyday things that are going up

  • The price of oil is up over 50% from a year ago. In April 2009 it was $50 a barrel now it is $84!
  • A gallon of unleaded gas is up 15% since April last year!
  • Cotton is up 30%
  • Copper prices are up 57%

Now, you tell me, is that 0.1% inflation? I don’t think so! The average price appreciation of the above, which are pretty much staple items, is over 10%.

That’s even a bit higher than the action we’ve seen in the Commodity Research Bureau’s Index (CRB Index) of 19 widely-traded natural resources and commodities. According to the index, prices of raw materials are up nearly 8.5% since the beginning of February.

And don’t get me started on College tuitions as are projected to increase into the double-digits in many cases for the 2010-2011 school year.

Government around the world are massaging figures – protect yourself and start your own Personal Savings Plan today as now is the time for DIY.
Marc Faber on China

Posted on 23rd April 2010 by Trevor in Blog

Why you should buy Gold.

Posted on 1st April 2010 by Trevor in Finance in Focus

Fundamental Reasons Gold Will Soar

You Can’t Ignore Inflation: The 2008 stock market panic sent stock and commodity prices – including the price of oil – into a tailspin. And that launched the big debate about whether inflation or deflation would ultimately carry the day. Keep in mind that since 2001 – under benign price inflation of roughly 2.5% – gold has managed to rise about 400%. Meanwhile, the U.S. Federal Reserve is widely expected to keep short-term rates near zero through this year, leaving the door open for inflation. In addition worldwide, central banks have rolled out an unprecedented $12 trillion worth of stimulus programs, with some of the money still to be spent.  Inflation is coming just don’t know when . . .

Inflation explained: When the economy goes down, people save more. When that happens, circulating M2 (money) also goes down because less people are spending. That would make the economy even worse, so what the government does, is it borrows money from the Fed, which makes money out of absolutely nothing, and then lends it to the government at interest.  Then this new money sort of replaces the saved money, and the recession should hopefully not get worse. 

Then, once things are better, this new money which eventually floats around is deposited at banks. Banks then use this as high powered money to create more money from thin air. About 90%, so, you deposit, $10,000, the bank can lend $9000. This isn’t YOUR $9000, it is brand new money. Your $10,000 is still there, this process doesn’t end there. Now there is $9000 of new money in the economy. That then gets deposited at another bank. Now that bank can lend $8100, and so on until about $90,000 is effectively created out of thin air!

That’s why the bailout of $700B will eventually reach about $7 Trillion. (This will expand the money supply around 30% to 50 %.) The money hasn’t been “unlocked” yet (banks are not lending).  So, once the economy picks up again, and it’s going to need employment for the money to be unlocked, we could see a lot of inflation; maybe even 10% a year for a few years.

Investment Demand is out there: Large institutional investors – hedge funds and pension funds – are making large allocations to gold, as are individual investors.  The proliferation of gold-focused exchange-traded funds (ETFs) bears this out. The SPDR Gold Trust (NYSE: GLD), the world’s largest physically backed ETF with 1,100 tons of the lustrous metal, is the sixth-largest holder of gold bullion. Individual investors have never had an easier avenue for owning gold. (However maybe this is not the best way as it is not 100% backed)

Asia, with a population that exceeds 2.5 billion inhabitants and a long-standing cultural affinity for gold, is stoking global demand in a big way. China is encouraging its citizens to buy gold and silver.

Central Banks are Becoming Net Buyers: India’s recent purchase of 200 tons of International Monetary Fund (IMF) gold was the likely impetus that pushed gold up over the $1,200 level in December. But more important is the sea change that has seen central banks change from net sellers into net buyers of gold. BlackRock Inc. one of the world’s largest investment managers, said that 2009 was that turning point. If that was the case, it will have been the first time in 20 years, as central banks have been net sellers of gold since 1988.

A Currency Crisis is Looming: The “PIGS” – Portugal, Italy, Greece and Spain (or “PIIGS,” if you want to include Ireland) – aren’t in very good fiscal shape. And they aren’t alone. Iceland has already gone over the edge. The United States, the United Kingdom, and countless other economies are struggling. And that reality has ignited a crisis of confidence about fiat currencies in the minds of many investors. Money is nothing more than paper and ink, backed by the full faith and credit of the issuer. When investors find that their faith in the issuer is shaken, the value of that currency erodes. Additional sovereign-debt downgrades from ratings agencies are but one potential trigger of a currency crisis. Under such conditions, gold – the ultimate store of value, and the oldest existing form of money on earth – will soar as investors seek to protect their purchasing power.

We’ve Yet to Reach the Mania Stage: the gold bubble that takes prices to all-time-record levels will inflate in three distinct stages. This process will start with currency devaluations in Stage One, will be fueled by growing investment demand in Stage Two and will experience its stratospheric ascent in Stage Three, the mania phase of this evolution.  Keep in mind, the entire gold industry has an aggregate market capitalization (value) below that of Wal-Mart Stores Inc. (NYSE: WMT) alone (currently about $210 billion). So as the crowd piles in, the “big money” to be made will lie with gold explorers and producers, where 1,000% returns will not be uncommon, even from today’s prices.

All these fundamentals underscore that gold prices have plenty of room to run from here.   All the physical gold in existence is worth somewhat more than $1 trillion US dollars while the value of all the publicly traded gold companies in the world is less than $100 billion US dollars. When the fundamentals ultimately encourage a strong flow of capital towards gold and gold equities, the trillions upon trillions worth of paper money could propel both to unfathomably high levels.

It’s Time to Make Your Move

Everyone needs some exposure to gold in their portfolios, no matter their age or risk tolerance. Owning some physical coins or bars makes sense.

When will gold really take off? I think it will take a few years. But with bubbles, or speculative frenzies, one never knows. Just this week, in fact, Robert R. McEwen, the chairman and chief executive officer of U.S Gold Corp. (AMEX: UXG), predicted that gold could more than quadruple to hit the $5,000 level by 2012. Some experts have labeled this expected move as a looming “super spike.”

Despite the mania stage (we think) is still several years away, the wise investor recognizes both the importance and the potential of investing in gold.

I have no doubt that today’s $1,100 gold price level will eventually, in hindsight, look like an outrageous bargain.

WAYS TO OWN GOLD

There are many ways to own gold. The best way is to buy a few one-ounce gold coins, preferably American eagles if you’re in the United States, or Canadian maple leaf coins if you’re in Canada. With one-ounce coins, you pay the lowest commission.  The trouble with gold coins is also their advantage: they are in your possession. They can be lost or stolen. They must be mailed back to a coin dealer to sell them for money. There are commissions to pay. But, in a time of national crisis, coins are the best way to hold gold for the small investor.

You can buy gold shares – a very good idea. This is the standard approach of most investors an easy way would be with GDX or GDXJ – exchange traded funds.  There are gold miner shares on almost every exchange.

There is a Fund which invests 60% of its assets into physical gold the other 40% is invested in Managed futures which since 1990 has achieved returns of over 17% pa.

There is a fund, the Central Fund of Canada, that holds mostly gold and some silver bullion. The prices of the two metals move in tandem most of the time. Owning shares of this fund is a surrogate for owning physical gold. This is far better than GLD as there you are buying paper and not all the gold is actually there!

Always remember: if there is no proof of physical possession of gold, and if there are no storage charges for gold held in reserve, then you may be trading a futures contract, which is a promise to pay gold on demand. Promises to pay are never as reliable as gold in hand. Third-party verification of gold held against receipts issued for gold becomes important.

You should ask yourself what you are hedging against. Answers include the above fundamental reasons in the report, plus these more specific ones:

  • Dollar inflation/depreciation
  • Terrorist attack on the U.S.
  • Crisis in the bank payments system (cascading defaults)
  • Speculation: Asians may start buying gold

WHAT IS THE DOWNSIDE RISK?

The standard ones are these:

  • Net central bank sales of gold to public
  • Recession reduces price inflation
  • Recession reduces demand for commodities
  • Asians turn out to love paper money more than gold
  • Governments outlaws gold  
  • Gold-owning people actually obey the governments

The political pressure is very strong to keep a higher price of gold from identifying reduced confidence in the dollar. We have seen the government take steps to push down gold’s price. But the government also sells gold coins. It maintains the official position that gold is not relevant for monetary affairs. To outlaw gold would be to admit that gold is relevant. This might turn into a gold-buying panic. Because people can easily buy and sell gold on the Web, there are ways for people to evade the law.

A worldwide recession is possible if China suffers a major recession. China at some point will have to go through a recession because of today’s inflationary policies. But the question is: When? Gold may fall 30% from $1,100 an ounce if it does buy some more. If you have no gold, it’s not wise to bet the farm on a fall in price. Besides, if gold falls, you’ll probably think, “It’s going to fall even more. I had better wait.”  The Greece situation is the next thing to happen will they or will they not be bailed out, but really the bigger situation is who is next as Greece is about as relevant to the European economy as say Utah is to the USA.  Now what happens when California needs a bailout it is the 8th largest economy in the world on its own. Then longer down the line there is Japan the third largest economy . . . and in the end the USA.

CONCLUSION

People postpone doing what they don’t really want to do. They don’t want to take action that implies that the present system is shaky, that the government is following policies that will debase the currency, and that there is no way for the government to preserve the purchasing power of the dollar by anything other than ceasing all monetary expansion, which the Federal Reserve System never does.

April 2010 Finance in Focus

Posted on 1st April 2010 by Trevor in Finance in Focus

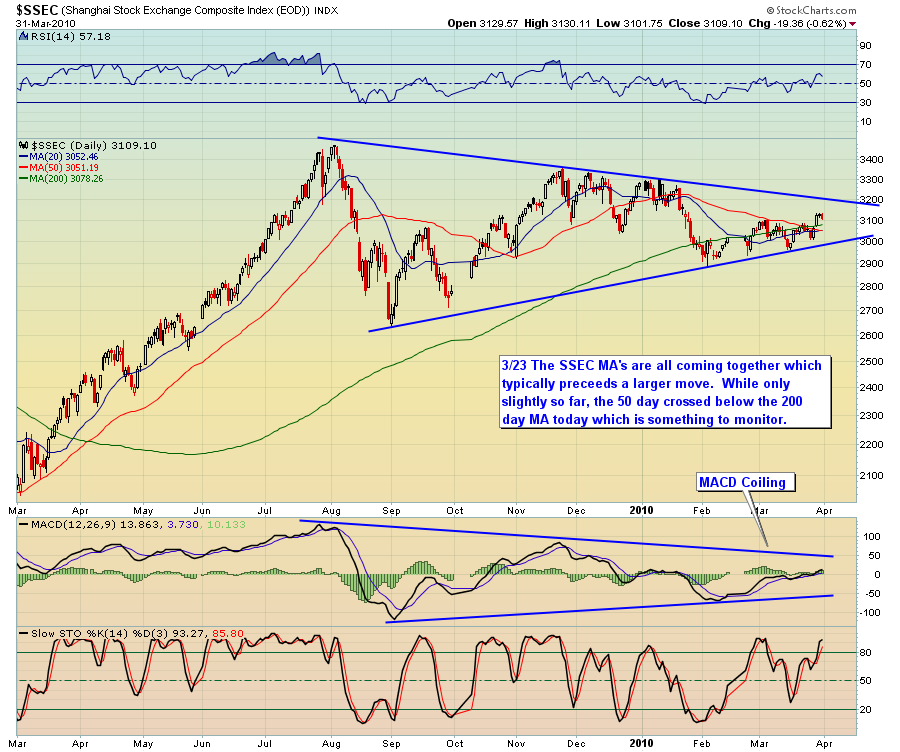
Here’s some food for thought: the Chinese market bottomed first, it bottomed in November of 2008, whereas the US Markets (and most world market’s) bottomed in March 2009.  Currently the SSEC and Chinese markets have not made new highs.  Perhaps this time around the Chinese market will top first, whereas it bottomed first last time.  Who knows, but it has a VERY nice triangle setting up, let’s see which way this breaks, if it’s to the upside instead, that would be super bullish, if it’s to the downside . . .something to keep note of we think.


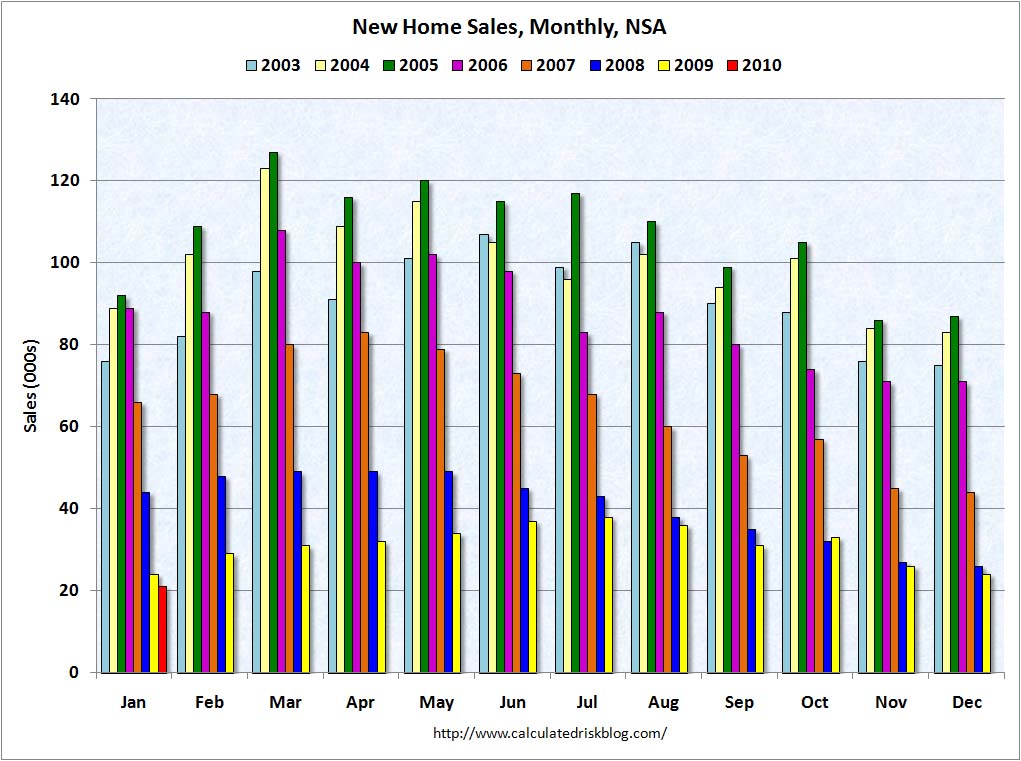
New Home Sales at Record Low

The Census Bureau reported that sales of new single-family homes in February were at a seasonally adjusted annual rate of 308,000. This is a new record low and a 2.2% decrease from the revised January rate of 315,000.

Some attribute the record low sales to February’s weather, which covered much of the country in snow. Others contend that the new home tax credit that was originally supposed to end last year merely moved sales that would have taken place this year to last year. In my view, both factors likely played a role in the February figures, but it’s clear from this chart I found on www.calculatedriskblog.com that the housing market is still in deep trouble.


And in case you think we may have finally reached the trough of the housing crash, I’d like to remind you about the overhang of ARMs (adjustable rate mortgages) that is due to reset over the next two years. There’s a lot of default on the horizon and the market will tank further.


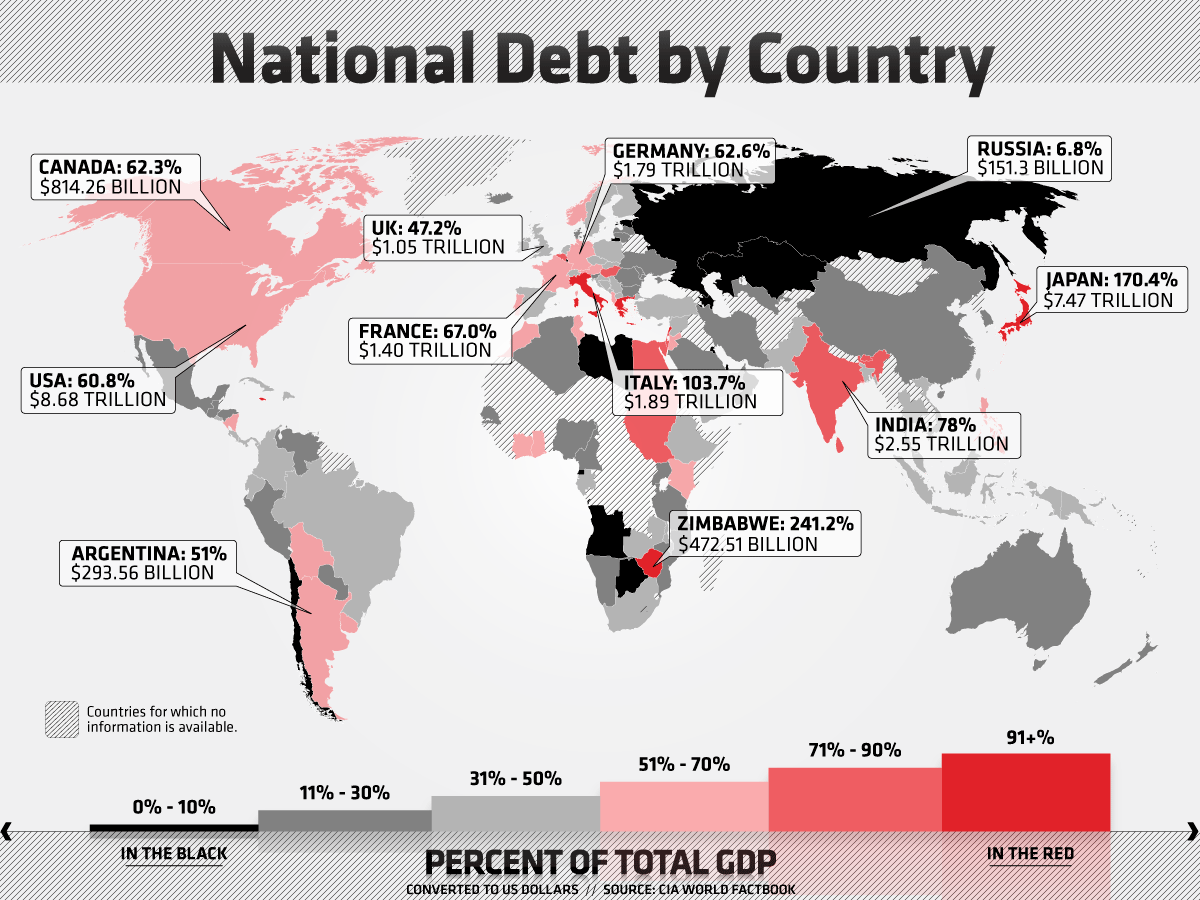
The national debt of countries represents how much money the government of that country owes. Like a household budget, national debt gets larger when a government spends more than it takes in. This can continue for years, or even decades. This budget deficit is the total amount of this debt that has grown over time, with interest charged adding significantly to the amount owed by the government.

The amount owed varies greatly with the amount of money a country generates, its population and how much its government spends. In Germany, the national debt is $1.79 trillion. This represents 62.6 percent of Germany’s gross domestic product, or GDP. In The U.K. the national debt is $42.2 trillion. This is 47.2 percent of the GDP of the U.K.

In Russia, the national debt is $151.3 billion. This is 6.8 percent of the Russian GDP. Italy owes a national debt of $1.89 trillion, or 103.7 percent of the Italian GDP. The national debt of France is $1.40 trillion. This is 67 percent of France’s GDP.

One of the highest levels of national debt relative to the country’s GDP can be found in Japan. The Japanese national debt is $7.47 trillion. This is 170.4 percent of the Japanese GDP. India has a national debt of $2.55 trillion. This debt is 78 percent of the GDP of India. Zimbabwe has a national debt of $472.51 billion. This level of national debt is 241.2 percent of Zimbabwe’s GDP.

In the Americas, The United States has a national debt of 8.68 trillion. In the U.S., this is 60.8 percent of the American GDP. The Canadian national debt is $814.26 billion. In Canada, the national debt is 62.3 percent of the GDP. In South America, Argentina has a national debt of $293.56 billion. The Argentinean national debt is 51 percent of the GDP of Argentina.

The gross domestic product of a country is the market value of all of the products and services that a country produces in one year. This includes spending that is done by the citizens of the country and by the government of that country. It includes the value of items produced within the county and exported elsewhere, but it does not include the value of any imported items. The GDP is the primary way to calculate the size and status of the economy of a country as a whole. It is calculated quarterly as well as yearly.

A comparison:  Fitch downgraded Portugal’s debt aweek or so ago and Monday the 29th of March they also downgraded the State of Illinois to a- (which is 4 grades above JUNK)  — lets put this in prospective.  Illinois GDP is 633 Billion.  Portugal is 236 billiion and Greece is 343 Billion – Therefore Illinois is bigger; this mountian of Debt is just starting! 

Why you should Buy Gold.

Good news for International School Parents in Japan

Posted on 1st April 2010 by Trevor in Uncategorized

Thursday, April 1, 2010 Japan Times
Public school tuition waived Pro-Pyongyang institutions may get subsidies

The Diet enacted a law Wednesday waiving public high school tuition, a key promise in the Democratic Party of Japan’s election campaign last year.

Starting Thursday, students of public high schools will be exempt from tuition, while private high schools will receive a subsidy of ¥120,000 to ¥240,000 a year per student depending on household income.

Education minister Tatsuo Kawabata has indicated that international schools and those with curricula of other countries will be eligible for the program if they pass an evaluation, with some receiving subsidies as soon as this month.