Critical Illness

Posted on 25th February 2010 by Trevor in Blog

What would happen if you suffered a serious illness? What level of cover do you have and is it enough?

If you have to rush your injured child to the emergency room, following some sort of accident, you don’t ask questions about what the sutures or the bandages cost. In fact, you probably don’t think much at all about the cost of the care that is being delivered, your only concern is that it works.

That’s most people’s response when they receive a diagnosis of cancer too. Few of us are going to stop to quiz the oncologist about the cost effectiveness of the treatment that gets proposed-our only concern is to get the treatment that gives us the best chance at survival.

And yet when you do survive, as more and more cancer patients are doing, the bill will come due. And that’s when you would wish you have had more candid conversations early on about prices and options.

Millions of people throughout the world suffer heart attacks, strokes, or contract cancer. Most of us know of someone from our circle of friends of families who have suffered from some form of serious illness. When we are ill, the last thing we want to think is our finances. However, failure to have a plan in place, could end up being your biggest setback down the road.

If something terrible happened to your child and you didn’t have insurance, wouldn’t you probably mortgage your house to make sure they were cared for?

Critical illness cover is a relatively recent addition to the life insurance industry. This benefit pays a lump sum to clients if they are diagnosed with a covered illness. It gives them leeway to relax about their finances and focus on getting better.

The Life Plan is a flexible regular premium insurance policy that offer a cover benefit for the whole of your life and will pay a lump sum if you are diagnosed with terminal illness or on death. It also allows clients to choose the right amount of critical illness cover that meets their financial circumstances. The minimum level of Critical illness cover starts at USD 45,000 and goes up to a maximum of  USD 750,000.

  • Premiums depend on your age at the time of the contract, amount of cover, whether you are a Smoker or not, your Health condition and whether additional benefits are selected.
  • Payments can be made in USD, EUR, GBP, JPY on a monthly, quarterly, semi-annual or annual basis
  • Other Benefits: Term life cover, Accidental death benefit, Term critical illness cover, Waiver of premium (if you are unable to work)
  • Extra benefits (no cost): Airplane cover, Children’s critical illness cover, Guaranteed insurability cover, Repatriation benefit, Temporary accidental death benefit (cover while the company processes your application)

Without further delay you can have peace of mind that your loved ones will not be left financially vulnerable.

If you would like to receive the literature of Life Plan, please contact us. Free quotations are also available on request.  Call on 03 5724 5100 or email.

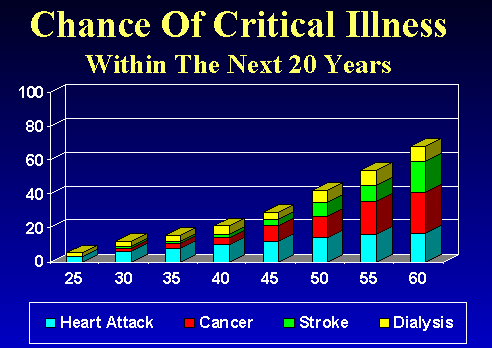
How likely is it? 

While an average 40 years old has only 1 in 5 chance to suffer a critical illness in the next 20 years, for a 50 years old this chance is already 1 to 2.5. Notice that only the most frequent critical illnesses are considered here.

The Cost of Delay

Posted on 23rd February 2010 by Trevor in Blog

If you’re 40 and you want to retire at 60 you’ve got just 240 pay days…what if you’re 50? Do the math. Oh, and did we forget to mention inflation? Scary stuff isn’t it! Nonetheless, don’t give yourself sleepless nights as by saving and investing regular amounts, however small, you can make a difference and avoid financial disaster. For those of you already retired, by carefully investing a lump sum you can maximize your income potential. There are so many more retirement savings options available to you as an expat that give you tax benefits, financial benefits and flexibility benefits.

Put very simply you need to save less the earlier you start, as you get older you need to save more of your income. So if you are 25 great, save at least 10% of your income and you will be fine later in life. If you are 40, and have not yet started saving you need to put away at least 20%.

Regular investment . . . it works

Posted on 23rd February 2010 by Trevor in Blog

The World Markets are volatile but if you are a regular investor with a reasonable time horizon this is an incredible opportunity. Why you ask? Because of the power of monthly investing.

There are a couple of reasons why you would want to invest in your on a monthly basis rather than wait until the end of the year or to try time it (no one can correctly with any real consistency). The first reason is obvious to everyone, a little bit invested is usually not even seen on a monthly basis, just another bill on the credit card!  If one invested once a year it is either avoided or thought of as a gee I would rather have a . . .  and it is spent not saved. (We see this a lot!)

There is a good investment reason why you would want to invest on a monthly basis that isn’t so obvious. In the industry, investing on a regular basis is called “dollar cost averaging”. I don’t know who invented that term, or if they meant for it to be descriptive, but it doesn’t really describe anything to me. “Investing regularly” is more descriptive to me.

I am going to look at three scenarios, in each scenario we invest $100 monthly:

  1. one where the investment goes up steadily, month after month, starting at $10.00 per unit and ending up at $12.75;
  2. one where the investment goes up, and down, up and down, starting at $10.00 per unit and ending at $12.75; and lastly
  3. a horrible investment that starts at $10.00, goes steadily down until it hits a bottom of $5.00, then slowly works its way back up to $10.00, the original price.

Which is the best investment? Intuitively the first one is the best, followed by the second, followed by the third. If that’s what you picked, you would be right if you had a lump sum to invest, but completely wrong if you were investing regularly.

Let’s look at the numbers.

Example a) Investment goes straight up;

Month Monthly Investment Unit Price Units Purchased
January $100 $10.00 10.0000
February $100 $10.25 9.7561
March $100 $10.50 9.5238
April $100 $10.75 9.3023
May $100 $11.00 9.0909
June $100 $11.25 8.8889
July $100 $11.50 8.6957
August $100 $11.75 8.5106
September $100 $12.00 8.3333
October $100 $12.25 8.1633
November $100 $12.50 8.0000
December $100 $12.75 7.8431
Total $1,200 106.1081

Market Price = Total Units x Most Recent Price = $12.75 times 106.1081 = $1,352.88

Profit = Market Price – Cost = $1,352.88 – $1,200 = $152.88

Example b) Investment goes up and down, up and down, much like the market does in reality;

Month Monthly Investment Unit Price Units Purchased
January $100 $10.00 10.0000
February $100 $9.75 10.2564
March $100 $9.50 10.5263
April $100 $9.25 10.8108
May $100 $10.00 10.0000
June $100 $10.25 9.7561
July $100 $10.50 9.5238
August $100 $9.75 10.2564
September $100 $11.00 9.0909
October $100 $11.50 8.6957
November $100 $12.50 8.0000
December $100 $12.75 7.8431
Total $1,200 114.7596

Market Price = Total Units x Most Recent Price = $12.75 times 114.7596 = $1,463.18

Profit = Market Price – Cost = $1,463.18 – $1,200 = $263.18

Example c) investment starts at $10 drops to $5 then goes back up to $10, like when the market crashes.

Month Monthly Investment Unit Price Units Purchased
January $100 $10.00 10.0000
February $100 $9.00 11.1111
March $100 $8.00 12.5000
April $100 $7.00 14.2857
May $100 $6.00 16.6667
June $100 $5.00 20.0000
July $100 $5.00 20.0000
August $100 $6.00 16.6667
September $100 $7.00 14.2857
October $100 $8.00 12.5000
November $100 $9.00 11.1111
December $100 $10.00 10.0000
Total $1,200 169.1270

Market Price = Total Units x Most Recent Price $1,691.27

Market Price = Total Units x Most Recent Price = $10.00 times 169.1270 = $1,691.27

Profit = Market Price – Cost = $1,691.27 – $1,200 = $491.27

The dollar cost averaging profits.

Scenario 1 Scenario 2 Scenario 3
$152.88 $263.18 $491.27

The investment that looked to be the worst was actually the best. Wouldn’t you agree that dollar cost averaging, or, simply investing regularly is a pretty good way to invest?

A monthly savings with Royal Skandia –  Why?  Cost averaging and the fact Royal Skandia has re-launched their special offer for 2009 and their plan is the cheapest monthly savings product on the market – the cost to get into the funds is only 0.49%.  Skandia has a 1% management charge and an $8.50 monthly administration fee, that’s it.  What I am suggesting here is, if you want to save for 10 years – this is the best plan – providing US$750+ a month is a comfortable level to save each month. The benefit of dollar cost averaging will be at work here and you can more aggressively invest in emerging markets. There are good companies in emerging markets available on the very cheap now, the economic deep freeze won’t last forever. If you build positions in Energy, Gold, Asian, Chinese, Indian, Latin American and Russian investments for a few years, you will be amply rewarded over time.

Get in touch with Banner today and get something started, as you will be happy you did. As Few people in their twenties, thirties or even in their forties give serious attention to their pension savings. Retirement may seem a long way off to you and other financial demands seem more pressing. But because of increasing longevity, earlier retirement and higher expectations in retirement, not to mention numerous state schemes moving “into difficulty” are all compounding reasons which increases the need to plan. Take the time to review your options, and ensure that you’re prepared when it’s your turn to retire.  And call Banner as we can help.

Asset allocation – where should you be invested?

Posted on 22nd February 2010 by Trevor in Blog

Asset allocation – where should you be invested?

Modern Portfolio Theory

Early in the 1950s Harry Markowitz suggested that asset allocation accounted for approximately 90% of portfolio performance on a risk-adjusted basis, a figure that has been borne out repeatedly by subsequent studies, and incidentally gaining him a Nobel Prize for Economics in 1990. This suggestion is called Modern Portfolio Theory. It holds that a diversified range of assets will produce not only more consistent but also better returns over time than contending ways of running a portfolio, namely securities selection and market timing. It is in fact a staggering observation on Wall Street activity that the hundreds of millions of dollars spent annually on stock research and the timing of buys and sells don’t make that much difference to portfolio returns (although they do foster investor illusions and thus public enthusiasm to invest). But Markowitz’s suggestion is that the area really worth concentrating on is asset allocation. In other words the baskets.

A rigorous application of Modern Portfolio Theory will distinguish among kinds of stocks (large cap / small cap; value / momentum; sector), kinds of bonds (high grade / high yield; sovereign / corporate), and both across currencies. This kind of asset allocation matrix makes for a much more thoroughly diversified and therefore durable and efficient portfolio. We can also add into the mix property, both as value (although property values do not always go up, as in the UK in the late 1980s and of course right now) and as income. And then there are commodities, an interesting asset class; as they tend to rise and fall counter-cyclically to the broad stock market – although of course commodities stocks are powered by commodities prices.

Finally, a modern asset class not available to Markowitz at the time is hedge funds, by which I mean disciplined alternative strategy funds that achieve returns in a wide variety of market conditions by hedging out risk.

So let’s have a brief look at the various baskets.

1.       Market-Neutral/Absolute Return

2.       Capital Guaranteed Market-Neutral/Absolute Return

3.       Equities Market Long

4.       Specialist Equity Theme Funds

5.       Commodities and Precious Metals

6.       Housing

1. Market-Neutral/Absolute Return: funds that seek to provide positive returns in whatever market conditions and thus do not depend on stock or bond prices going up to make money. In an environment where major stock indexes could well be sideways to down for several years, and bond prices are vulnerable to government liquidity pumping, with the attendant threat of inflation, absolute return funds are an attractive asset class. The following suggestions cover a range of volatilities.

2. Market-Neutral/Absolute Return with Capital Guarantees: same as in the above section but there is a safety net underneath the investment provided by an international bank of at least AA- strength. After a specified period you are guaranteed at least your principal, and in some cases more, no matter what the performance of the fund, which provides peace of mind.  All capital guaranteed funds have a limited offer period after which they close. The guaranteeing bank has to know how much it is guaranteeing. Guaranteed funds therefore tend to get offered in tranches, several times a year. A fund past its offer period is retained on this list for illustrative purposes, and is replaced once the details of the succeeding offering have been confirmed.

3. Equities market long – if you have them ride them out, if you are not in equities wait as there are better entry opportunities ahead. Or look to start a regular investment plan and invest into the eye of the current crisis, yes at least 10% in financials.

4. Specialist Equity Theme Funds; while we are not especially hopeful about the future performance of major stock markets, some (currently) smaller markets and specialist equity funds have provided superior returns and we think they will continue to do so over the coming years. Some of these funds are partially hedged (seeking to capture gains from the fall of weak stocks, as well as from the rise of strong stocks).  Some are macro bets – for example on the rise of the Indian middle class, or on the wealth of Russian resources versus the tiny size of the stock market through which they are capitalized. Of course these funds carry the risk of large loss, but also the promise of large gain.

5. Commodities and Precious Metals; asset classes go through long cycles of bull markets and bear markets.  Arguably major market stocks and bonds have been through long bull markets and embarked on bear trends. Commodities, led by the precious metals, starting 1999/2001, have embarked on a bull run, after twenty years of bear market, and once underway commodities bull markets tend to last 15-20 years.  The demands of large emerging economies as well as supply and capacity constraints are sending commodity prices higher and will continue to do so for the foreseeable future. We believe investors should overweight investment in this sector, partly in the pursuit of profit, and partly as insurance against the prospect of inflation.

Most investors are wondering if the bubble has burst or if this is just a correction. Frankly, I don’t blame them. Downturn has been sharp and a lot of portfolios are a lower than they were just two months ago. In our view the recent commodity correction is just that: a correction. But it’s for a reason that we hardly ever hear about. It’s been an ugly couple of months and investors are naturally getting nervous. But now, when other investors are anxious, irrational, and running scared, it is the time to start wading back in to commodity stocks.  We all know the basics. China, India and other “emerged” markets have seen their economies grow at a double-digit rate, for years. Meanwhile, the mining industry has suffered from a 25-year spell of under investment. There aren’t enough mines. Demand has remained strong and supply continues to lag in most base and precious metals, agriculture commodities, and energy.

Jim Rogers, hedge fund manager who wrote the book on the emerging commodity bull market in 1999, says, “Throughout history, bull markets in commodities have lasted a long time. They’ve averaged about 18 years or 19 years. The shortest I could find was 15 years; the longest was 23 years.”

6. Housing; best avoided for the next while our best guess is look for opportunities as they arise over the next several years.

A final thought; Energy prices will rise again and faster this time. Reasons behind this are also very simple, consider that in 1850 it took 1 unit of energy to get 100 units back; this was good and society changed immensely due to the sudden surge of excess energy. The units of energy in the 1990’s went down to 1 unit in to extract 25 units – today we are at a situation where it takes 1 unit of energy to get back 10. This is basically what peak oil is all about, we have used all the easy to get oil, and now the oil we are getting is more energy and cost intensive. This tells us one thing, in the coming years energy will cost a lot more. One needs to start building positions to profit from the coming shortfalls. When one considers all the press about the Tar sands in Canada and how they have more oil the Saudi Arabia it all sounds good but the reality of this is; the energy in of 1 unit only gives back 3, we am quite sure this will reduce in coming decades.

So the long and short of the market is – we are going through a horrible credit excess and this needs to be purged from the system, markets are down but they will recover in time and if you are looking in the correct places there is much money to be made going forward and we believe this is in hard assets.  (April 2009)

We look forward to helping you make use of current opportunities that will reward you in the years ahead, please get in touch with your Banner representative 03-5724-5100.

UK Tax – Residency and Domicile

Posted on 22nd February 2010 by Trevor in Blog

As far as the UK Inland Revenue is concerned, along with the Revenues of many other countries, you are considered to resident for tax purposes of you’re in the country for 183 days or more per tax year. Days of arrival and departure are ignored. Additionally, if you go and work abroad for more than one year, you must not be back in the UK for more than 91 days, on average, in any 365 day period, for the duration of your time abroad.

Another concept that many countries use is that of ‘ordinarily resident’. This is the country that is your normal home, year on year, with no big foreign excursions.

As such, you can be ‘ordinarily resident’ but not ‘resident’. This is where you move overseas (or just go on a very long holiday) for a short time period — a year or so. Even if you spend more than a tax year abroad, you can still be ‘ordinarily resident’ in the country that’s your normal home. Like all rules governing taxation, the categories are never hard and fast.

You can also be resident in more than one country at once, depending on how your time is split between them, and depending on what their Revenue rules are. Unless there is a double taxation agreement between the countries you are considered resident in, you could be caught twice for tax — so get some advice.

If you go and work abroad, you are considered not resident as long as you’re away for more than one full tax year, and you don’t spend more than 183 days in any one tax year back in the ‘home’ country or more than an average of 91 days per tax year over the duration of your years abroad.

The UK Inland Revenue, though, makes exceptions to these rules if you have to return to the UK for ‘compassionate reasons’ in a tax year. That means the death or serious illness of a loved-one. They will not sting you if you just exceed the limit through no fault of your own.

What about my spouse?

So-called ‘trailing spouses’ are considered by the Revenue to be non-resident under similar rules to the main bread-winner — that is, 183 days in or out of the country.

What if I move abroad permanently — buy a house, that sort of thing. Will I be caught in the UK tax net if I return to the UK regularly?

It depends how regularly. If you go abroad permanently, for a start you have to be able to convince the Revenue of it. Just buying a house is not enough, although it helps. You will still be caught for tax purposes if you return to the UK for more than 91 days per year overall.

Does this apply to all occupations?

No. some jobs come under special rules. These include civil servants, members of the armed forces, EU employees, workers in oil and gas exploration and sailors in the Merchant Navy.

So what is the difference between all this residency stuff and ‘domicile’?

For a start, watch out for this one because according to the Revenue’s own guidelines, “It is not possible to list all the factors that affect your domicile”. But basically, there are two ‘domicile’ concepts:
One is where you have your permanent home (not the same as residency, since that is where you spend your time for tax purposes).  The second is your ‘domicile of origin’, which is where your father’s permanent home was. So, you could have been born in France, but if your father was English, your domicile of origin is Britain.

They sound like the same thing!

Domicile and residency usually go together, it’s true. But for certain taxation purposes — the taxation of securities income, for instance, or for inheritance tax — your particular mix of residency, ordinary residency, domicile and domicile of origin will matter.

So I’m stuck with the domicile of my father whether I like it or not?

No, you can change it once you reach 16. But you have to convince the Revenue that you really have left the UK for foreign shores permanently. Just living abroad for a long time may not be enough.

In Summary

Generally, if expatriates work abroad for more than one full tax year, they become non-resident for tax purposes in their home country. This allows them to enjoy a number of tax advantages. For instance, normally they would not pay income tax in their home country and instead pay income tax at the local, often lower rate; they also avoid paying capital gains tax on any chargeable gains made on assets acquired and disposed during that period of non-residence. However, failing to plan ahead for a hasty departure could leave ex-pats with heavy losses.

Whilst expatriates often enjoy significant financial benefits working abroad, failing to transfer their assets out of the foreign country in the most tax-effective way could result in significant losses. Even if ex-pats are not immediately thinking of returning to their home country, political instability has led to an increase in the possibility of a sudden relocation and they should definitely be planning how their financial assets will be transferred.

Top Tax Tips

  1. If you return home before a full tax year has been completed, returning ex-pats should consider taking a holiday in a non-UK country to extend the period out of the country until after the start of the next UK tax year. Doing so will qualify them for non-resident status. Otherwise a concession has to be applied for in the UK to avoid paying UK rates of tax.
  2. Dispose of and reacquire any assets which are sitting at a capital gain immediately prior to returning to the UK. In this way the gain is crystallised during the period of non-residency, avoiding UK capital gains tax. All gains arising during the period of non-resident ownership would effectively be wiped clean. This could apply to stocks, shares and property.
  3. Do not dispose of any capital assets which are sitting at a loss since such losses, if realised after they resume UK residence, could be set against future taxable gains.
  4. Close any interest-bearing bank accounts and reopen them immediately before returning to the UK. This will crystallise the crediting of interest to the account during the period of non-UK residence.
  5. Whilst working abroad, open an offshore bank account where interest will be credited gross – i.e. with no UK tax deducted at source.
  6. Place your investments inside a collective investment bond, a fully UK approved vehicle that will allow you to take 5% per year as a tax free income for 20 years. What’s more, by planning NOW, any un-used years can be rolled forward. So say you structure correctly now, and return to England in 5 years time, that’s a huge 25% tax free income to be carried forward. And if your retiring, this structure means that should you ever need long term care in the UK, this particular type of savings vehicle cannot be touched by the government. Many, many people already in the UK are now using this as a great way to protect their assets.

February Finance in Focus

Posted on 18th February 2010 by Trevor in Finance in Focus

Healthcare news in Japan — the ‘new’ developments concerning the National Insurance System/Renewing Visa scenario.

http://search.japantimes.co.jp/cgi-bin/nn20100202a1.html?utm_source=feedburner&utm_medium=feed&utm_campaign=Feed%3A+japantimes+(The+Japan+Times%3A+All+Stories)&utm_content=Google+Reader

DEBT WATCH

In 2009, the book This Time is Different – Eight Centuries of Financial Folly, by Reinhart and Rogoff, shed new light on the role of debt by compiling a database that looked at financial crises in 66 countries over a period of 800 years. The main standard in explaining more than 250 crises studied is whether debt is excessive relative to national income, even though idiosyncrasies apply in each case. They reiterate that this old rule (excessive debt) continues to apply, and this time is not different.

Take a look at the table below outlining federal government receipts (revenues) over the last decade.

If you do the math, you’ll notice that total tax revenues experienced an average annual increase of 0.9% over the past ten years.

Now look at federal government outlays (spending) over the same period.

So, while federal government revenues have grown by an average annual rate of less than one percent over the last decade, spending has nearly doubled during the same period and increased at an average annual rate of 7.9%.

Obama’s new budget calls for a nearly 9% increase in spending over the 2009 level. The only way we won’t have another record deficit in fiscal 2011 will be if tax revenues grow by almost 15%. I highly doubt that, given the state of the economy and unemployment levels. What’s much more likely is for tax revenues to ring in at similar levels to today, which would suggest a 2011 budget deficit of around $1.7 trillion (nearly 75% higher than the CBO’s forecast of $980 billion). Even if tax revenues somehow climbed back to the levels of 2006 – 2008, we’d still be locked into a $1.3 trillion-plus deficit, more than 30% above the CBO’s ridiculous forecast.

GOLD – time to buy more for Fiscal insurance.

1)     The fundamental case for gold is as strong as ever. Production has been falling since 2001. Supply is tight. Overall demand continues rising. Awareness is spreading. Concurrently, money supply is grossly bloated. Debt at all levels has skyrocketed. Dollar printing and bailouts seem endless. And most importantly, the dollar’s woes are far from over. That the abuse of the world’s reserve currency will lead to price inflation is inevitable. The destruction of the dollar’s purchasing power is not a short-term phenomenon and will take years to fully play out. Your best defense is gold.

2)     The gold price will hit another record high in 2010. Gold begins the new year with tremendous momentum behind it: central banks are now net buyers for the first time in 22 years… numerous hedge fund managers are buying physical gold… China will be crowned the world’s #1 gold producer and buyer… new gold ETFs were launched in Singapore and Hong Kong… it’s a long list. And the global arousal of interest in gold will only heighten as concerns about the dollar fester. Further, mainstream media’s usual chilly sentiment toward gold began to thaw late last year (albeit skeptically), and we expect that sea change to strengthen, particularly on gold’s next big leg up.

3)     Seize the day – the Mania is still ahead. Our view remains steadfast that the rush into gold (and silver) is yet to come. That said, we’re not convinced it’s going to happen this year (though it certainly could), but rather that 2010 may be the “platform” year when the stage is set for the big run-up. Translation: any big gold sell-off could be the last chance to get positioned at anywhere near today’s prices.

So, if gold falls into three figures, you’ll find me (and everyone else at Casey Research) queued at our friendly neighborhood precious metals dealers. And a gold price below $1,000 will truly be, in my opinion, a carpe diem moment.

Here are some examples of gains in junior gold/silver exploration stocks between the years 1975 and 1980:

Lion Mines – 1975 price: $0.07 / 1980 price: $380 i.e. an increase of 542,757%

Azure Resources – 1975 price: $.05 / 1980 price: $109 i.e. an increase of 217,900%

Wharf Resources – 1975 price: $.40 / 1980 price: $560 i.e. an increase of 139,000%

Mineral Resources – 1975 price: $.60 / 1980 price: $415 i.e. an increase of 69,067%

Steep Rock – 1975 price: $.93 / 1980 price: $440 i.e. an increase of 47,212%

Bankeno – 1975 price: $1.25 / 1980 price: $430 i.e. an increase of 34,300%

Energy:

The cheap, easy-to-pump oil is fast being used up.  To be sure, there were plenty of oil discoveries in 2009, especially in Brazil and the Gulf of Mexico. A whopping 10 billion barrels of oil was added to reserves, the highest rate since 2000. However, the world is consuming around 83 million barrels a day, which equates to 31 billion barrels a year. So, even in a good year, we barely replaced one third of the oil we consumed

The world is producing up to 93 million barrels per day, but production at existing wells is declining at up to 8% a year. That means we have to add more than 6 million barrels per day every year to keep production flat. Five years down the road, we’ll likely have to replace 30 million barrels of production. That’s more than three times the amount of oil (8.1 million barrels per day) that Saudi Arabia produced in 2009.

That means we have to drill a lot more wells. And the oil we find is very deep and therefore very expensive. Oil companies are now putting drills down 4,000 feet in the Gulf of Mexico to then drill through 35,000 feet of rock. These wells are deeper than Mount Everest is tall! Assuming that significant finds are made, it will still be 7 to 10 years before the wells go into production.

Oil prices longer term are going up, until there is an alternative . . . on final thought on Energy prices – do world’s governments actually want higher energy prices?  The simple reason is the TAX generated on these is greatly needed – as tax revenue in all other areas is falling. Things that make you go Humm?

Comment on BONDS from INSTITUTIONAL ADVISORS

Zero percent interest rates create different economic environment, just like Zero degrees Kelvin (a.k.a. absolute zero) creates a different physical environment. Once we hit 0% it is very difficult to turn back, mainly because we can’t go much lower and therefore we don’t get any more relief from a further decline in rates. While the great majority of experts are talking about exit strategies and are attempting to time when the Fed and BOC will start raising rates, I would like to point out that the Bank of Japan has stuck with a 0% interest rate policy for close to 2 decades. At this point, that appears to be the path of least resistance in my opinion.

provided by

Money isn’t everything, according to a group of affluent Americans surveyed by Merrill Lynch Wealth Management. Focusing on family and friends, it turns out, gained in importance through the recession.

Just over half of retired respondents with at least $250,000 to invest said they wished they had focused more on their “life goals” than on “the numbers,” according to the firm’s Affluent Insights Quarterly, released Jan 18th. In fact the leading response was wishing they had given more thought to how they wanted to live in retirement (38 percent) followed by wishing they had worked with a financial adviser earlier (23 percent) and given up more luxuries to reach their retirement goals (18 percent).

Getting advice on your Finances and insurance

Why do I need financial advice on life insurance?

Life insurance is a very personal product. There’s only one of you. And your cover needs to be tailored to your circumstances, and your budget.

The amount of cover you need, and the types of cover you need, can vary greatly depending on your individual circumstances.

Besides, not all insurance policies are created equal – some have additional, and included, benefits and features.

An adviser can also help you make your insurance more affordable by recommending strategies including:

  • taking advantage of the tax-effectiveness of insurance
  • combining your cover with a family member to reduce your premiums
  • choosing the right combination of benefits and extra options.

By looking at your income, your debts, and your family’s circumstances, a Banner adviser can help you get the right cover – and the right structure – to meet your needs and your budget.

Arranging life assurance cover is the best way to ensure your family is taken care of in the event of your death, giving both you and them peace of mind.

Just a reminder

All USA federal debt, including unfunded liabilities, isn’t 100% of GDP, but 500%+. In most industrialized countries, federal-government debt is between 350% and 360% of GDP. Eventually the U.S. will arrive at a point where interest payments on government debt all of a sudden go to 20%, 25%, 30% of tax revenue. And once you go above 30% you are done. You go into default or your currency breaks down and your system collapses. The problem you will run into first is a dramatic increase in individual tax rates. You’ll see bigger wealth redistribution programs than you can believe.

The end game for Japan?

Thoughts from The Absolute Return Letter – February 2010

The first country to really feel the pinch could very well be Japan; in the bigger context, Greece is just the appetizer. Japan’s debt-to-GDP ratio has grown from 65% in the early 1990s when their crisis began in earnest to over 200% now. Fortunately for Japan, the high savings rate has allowed shifting governments to finance the deficit internally with about 93% of all JGBs held domestically[3]. This is the key reason why Japan gets away with paying only 1.3% on their 10-year bonds when other large OECD countries must pay 3-4% to attract investors.

Now, predicting the demise of Japan has cost many a career over the years. Despite the ever rising debt, and contrary to many expert opinions, the yen has been rock solid and bond yields have remained comparatively low. I often hear the argument from the bulls that the Japanese situation is sustainable because they, unlike us, are a nation of savers. Wrong. They were a nation of savers.

Looking at chart 5, it is evident that the demographic tsunami has finally hit Japan. The savings rate is in a structural decline and the Ministry of Finance in Tokyo may soon be forced to go to international capital markets to fund their deficits. I very much doubt that non-Japanese investors will be as forgiving as the Japanese, and that could force bond yields in Japan in line with US and German yields. Herein lies the challenge. Japan already spends 35% of its pre-bond issuance revenues on servicing its debt. If the Japanese were forced to fund themselves at 3.5% instead of 1.3%, the game would soon be up.

So if you have Yen sitting in the bank time to move and take advantage of the current exchange rate  . .
Investment: Market Turbulence and the Emotional Conundrum

Posted on 18th February 2010 by Trevor in Blog

By Chris Cleary

“The recent stock market woes have dented my investing confidence, so I’m sitting on the sidelines right now. I’m scared markets will go down more…if they don’t I’ll curse myself!”

When is a good time to invest? Obviously at market lows. And to disinvest? Obviously at market highs. The dictum buy low/sell high is perfectly rational.

However, market conditions are always uncertain. Fluctuation is the mechanism of price discovery. Markets fluctuate perpetually: whether they are moving sideways, upwards or downwards. Sorting trend from fluctuation is only possible when trend is established—in other words, in hindsight—and the end of a trend is likewise only clear given the advantage of history, I.e. Too late for investment purposes. Even when a trend has been established, there is no certainty in real time when trend falters and turns that a market has reached a high or a low: highs can go higher and lows can go lower. Nobody rings a bell.

To complicate matters, human beings are both rational and emotional creatures. Sufficiently rational to think of ‘buy low/sell high’ and assent to it, and sufficiently emotional to want to do the exact opposite when market conditions become extreme. Fear of loss makes people shun investing when markets are falling; indeed, the more a market falls the more investment-averse people become. On the other hand, rising markets induce lust for gain, and the more markets rise the more achievable gain seems; the higher a market goes, the more people want in.

However, with a few simple risk control rules and the risk/reward characteristics of investing, market uncertainty is tolerable; with a mechanical system, it is possible to make money. It is the emotional side, when people come to investing, that lets them down, especially when exacerbated by mass mood swings. Money—or rather the resources and opportunities it represents—is an emotional, visceral thing. As soon as emotions are plied by extreme events, and are corroborated by the concurrence of the crowd, they interfere with judgement. Which is why the uninformed investor tends to invest when news is good, markets are a popular topic, and people are excited about investing. Most likely, such a scenario occurs going into a major top and the investor stays in until after that top and a considerable distance down the other side. The inverse is when all the economic news is bad and people want to stay out of the market (if they are not in it already). Bad news can get worse, of course, and down markets can fall further, but the time to buy is when there has been consistent bad news and people think worse is not possible. Exactly the time that most people don’t want to invest, is the best time to invest.

As I am sure everybody is aware, the news is bad and seems to be getting worse day by day. There have been prior indicators of this: markets rising just about straight up for four years, and the US yield curve inverting twice in the last year, which is a pretty sure lead indicator of recession. But until last summer it wasn’t clear what set of problems and related events would trigger market jitters that would go beyond mere skittishness into a bear market. Now we know.

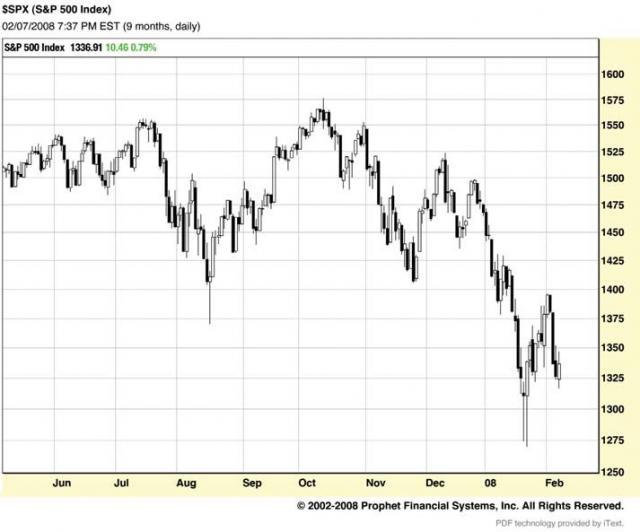
The graph of the S&P 500 at the current time of writing.

The graph of the S&P 500 at the current time of writing—I am using stocks as a proxy for ‘markets’ in general and the S&P 500 as a proxy for stocks—displays three sharp falls in the last half year on the same news complex. And it is a complex: a developing story in which each new chapter follows on with previously unsuspected but inexorable logic and widening frame of reference— unsuspected in this case even by the vast majority of inside players. Experienced pros are undergoing progressive disconcertment at the sheer scale of the effects of small causes, and powerful CEOs are losing their jobs. By the end of this story, not quite as many employees of financial institutions will have been fired as low-income families and/or topof-market entrants will have lost their houses, but they will; financial institutions’ profits will have been massacred, and their credit ratings decimated.

It is not the purpose of this article particularly to tell the causation story as it is generally familiar; it is recited here simply as the current example of bad news for a market. And it is bad news, make no mistake:

01 Mortgages are mis-sold in the US to people who can’t really afford them, in an overheating get-in-at-the-top housing market and on terms they don’t really understand; the mortgage terms involve later unexpected rises in interest rates that make the difficult-to-afford unaffordable.

02 Said mortgages are bundled to spread individual mortgage risk and sold (‘securitized’) as a bond equivalent, giving an income stream through repayments against a defined credit risk standard.

03 Said securitised bundles become building blocks in tiered bundles of loans of various investment grades (Collateralized Debt Obligations: CDOs) which are mathematically modelled to provide a defined risk/return profile at various levels of entry.

Credit

04 Said CDOs are then sold on with badged credit ratings in the debt markets to players (banks, investment houses, municipalities, pension funds, etc.) around the world who do not necessarily appreciate their complexity, or if they do, lose interest in the precise details of the next issuance; the combined risk/return profile subtly morphs through the transaction especially as the issuer of the CDO does not have to upgrade the risk profile of the whole package while the underlying credit risk of the instrument deteriorates in real time.

05 Said players devise sophisticated vehicles for said CDOs off their balance sheet but ultimately within their umbrella—SIVSs, shades of Enron’s raptors.

06 Bond insurers insure CDOs or the entities holding them.

07 Rates rise (at the time), or are contractually hiked at the assigned but not necessarily anticipated period.

08 The person at the bottom of the pyramid who couldn’t afford the mortgage, or was over-opportunistic in trying to get it, can’t pay any more.

09 The mortgage defaults, with evermagnifying shockwaves into the above tiered structures; billions in assumed value has become worthless. Bond insurers are over-exposed to the unisurable and sucked into the spiral.

10 Opacity and uncertainty (where is the debt hidden? / who are the walking wounded?) lead directly to reluctance to lend and thus a credit crunch which central bank easing cannot fully counter.

The benefits of financial engineering should be asserted against this surprised litany. Certainly it is useful to be able to bundle mortgages and thus spread risk, making mortgage lending more, and more widely, possible. And arguably, it is useful to further bundle bundled debts as it increases the capacity to offer debt—as long as debt is properly described and understood on both sides. As usual with financial engineering, it is a tale of ingenuity of great potential benefit to all, not only the contracted parties but society in general, gradually vitiated by greed (in obtaining fees for business on which there is no further responsibility), oversight (or rather the lack of due oversight), and complacency, which degenerate into a normally accepted practice— accepted until the consequences reveal themselves.

By the time this article is published, the S&P 500 chart will have fluctuated further: up a bit more, and then in a further, deeper plunge. There will be more bad news than there is at current writing.

Advice and further information on investment is available from:

Banner Japan
Tel: +81-3-5724-5100
Email: questions@bannerjapan.com
Chris Cleary is a Director of Banner Japan KK

This is a scenario expectation within a normal market paradigm. Market falls are not unique. Fear as an emotional experience makes them seem so, but they happen, and they happen on a regular basis. Markets cannot go up forever. Economic realities—which are the sum of human endeavour and frailties—proceed with the balance that is provided by price discovery. Good markets have an uptrend based in misgiving, in worry; bad markets emanate from over-enthusiasm and over-confidence. In other words, not only does the human emotional conundrum dispose people to act against their best interests; its excesses also usher in the character of the ensuing market counter-move. The new bull market will begin in fear and proceed nervously— until accepted, way later, as fact.

When is a good time to invest? There is an online quiz attached to this article at www.japaninc.com/market_quiz that will give you a brief historical tour, pose a few questions, and provide a commentary.

Implications for investing:

  • Fear and greed are out to get you. Cast a cold eye.
  • If you are a self-directing, risk-taking investor, you might want to pick up a few financials and homebuilders later in the year, but at your peril, and I wouldn’t advise doing so for a few months yet.
  • Hold diversified positions in different asset classes, so you do not care about any particular market or trend so much (J@pan Inc Issue 70). We have been advocating gold since 2001, and commodities since 2004.
  • Use the benefits of a long-term regular savings programme to take the worry and the snags out of the process. (J@pan Inc Issue 73) Medium to long-term, regular savings programmes work no matter what market conditions. This is especially the case if you do not have the time, the inclination, or the knowledge to invest directly on your own behalf.
  • Study market history and give it much more credence than the ‘news.’
  • Employ an adviser, if only to have someone to bounce ideas off. Also to ensure that someone else understands what you are doing: what would happen to your family if you were no longer around and noone else knew what was going on?