December 2010: Finance in Focus

Posted on 29th November 2010 by Trevor in Finance in Focus

The sinking ship of Japan

The Fed does not hold a monopoly on policy mistakes. On that account, Japan is in a league of its own, although many other countries are doing their very best to catch up. The Japanese combination of very high debt levels combined with outright deflation is a lethal cocktail, and one which the Americans are clearly desperate to avoid. I have borrowed two charts from Dylan Grice at SocGen to illustrate the enormity of Japan’s fiscal problems. Almost 60% of its tax revenues now go towards servicing its rapidly growing debt (see chart 1 below) and tax revenues no longer cover even the bare necessities – debt service, social security and education (see chart 2).

  1. 1.       Debt Service in Japan


Source: SocGen Cross Asset Research, Japan’s MoF

With the savings rate in free fall, and with record low bond yields, how much longer can the Japanese finance their debt domestically? Eventually, when they have to go to international capital markets to fund their out-of control deficit, will there be any buyers of 10-year JGBs at 0.95%? I very much doubt it. On that account, I have noted that the tide has already turned. As you can see from chart 3, there has been a substantial capital outflow from Japan this year.

  1. 2.       Tax Revenues in Japan


Source: SocGen Cross Asset Research, Japan’s MoF

You may ask, if investors are fleeing Japan, why is JPY not weakening? I only know one possible explanation (courtesy of Morgan Stanley). Much of the capital which is leaving Japan is finding its way into US Treasuries, and most of those investments are fully hedged, which neutralizes the effect on the currency. In short, when you take money out of Japan to invest in the US, you sell JPY against USD; when you subsequently hedge your currency risk, you sell USD against JPY.

Chart 3: Japanese Resident’s Activity in Foreign Bonds


Source: Morgan Stanley, Japan’s MoF

But the conclusion remains the same. If (when) there are no longer enough investors to buy the JGBs, or if (when) Japanese investors stop hedging their currency exposure when investing abroad, the pressure on JPY could become immense.

So get out of Yen while you can at around 80!

RMB Currency Trader. And I quote:

The Land of the Rising Sun has the dubious distinction of sporting the highest debt-to-GDP ratio of any industrialized nation in the world. Now greater than 200%, Japan’s relative debt load is bigger than that of Greece, Spain, Portugal or the US. Japan needs to borrow over 50% of GDP this year just to stay afloat, according to the International Monetary Fund (IMF), and its financing needs are expected to reach almost 60% of GDP next year. (See graph below.) Its strength has been somewhat befuddling, especially considering this growing burden of debt.


Why has the Japanese currency been so strong? Because despite all of the yen’s problems, Japan runs a trade surplus. Traders view that surplus as a source of funding which can be used to pay down Japan’s skyrocketing debt, making the yen seem like a “flight-to-quality” currency despite appearances. However, Japan’s strong currency is beginning to affect Japan’s ability to export. Competition from China and rising Asian powers such as Vietnam is also beginning to take its toll. Japanese industrial output fell 1.9% in September after dropping 1% in August.

To remind you why you should hate the Japanese currency, I’ll refresh your memory with this short list:
* With the world’s weakest major economy, Japan is certain to be the last country to raise interest rates.
* This is inciting big hedge funds to borrow yen and sell it to finance longs in every other corner of the financial markets.
* Japan has the world’s worst demographic outlook that assures its problems will only get worse. They’re not making Japanese any more (well just not very fast).
* The sovereign debt crisis in Europe is prompting investors to scan the horizon for the next troubled country. With gross debt approaching 225% of GDP,  Japan is at the top of the list.
* The Japanese long bond market, with a yield of a scant 1%, is a disaster waiting to happen.
* You have two willing co-conspirators in this trade, the Ministry of Finance and the Bank of Japan, who will move Mount Fuji if they must to get the yen down and bail out the country’s beleaguered exporters.

When the big turn is inevitably confirmed, we’re going from ¥83 to the initial target of ¥85, then ¥90, ¥100, ¥120, eventually ¥150

Make sure you have Your Own PERSONAL pension plan!

The Toronto Sun reports, Canadian Feds have $65B pension funding shortfall:

The federal government has underestimated its employee pension obligations, exposing taxpayers to a $65 billion shortfall, according to a new report released Thursday by the C.D. Howe Institute.

Using fair-value accounting, the measure used in the private sector and based on solvency, the think tank calculated Ottawa’s net pension obligation stands at nearly $208 billion. That’s $65 billion more than reported in the public accounts.

The government lists its unfunded liabilities in the country’s national debt at $143 billion.

Taxpayers could be on the hook to back-fill the funding gap, the report by Alexandre Laurin and William Robson said.

On top of that, large exposure to public sector pensions could fuel fears of sovereign default driving up the cost of borrowing.

“The larger-than-reported gap between federal pension promises in these plans and the assets that back them is a problem, both for federal employees and for taxpayers,” the pair said.

But Canada is not alone. European and U.S. governments share the problem. The United Kingdom for instance is facing a $1.8 trillion shortfall and the U.S. has $3 trillion.
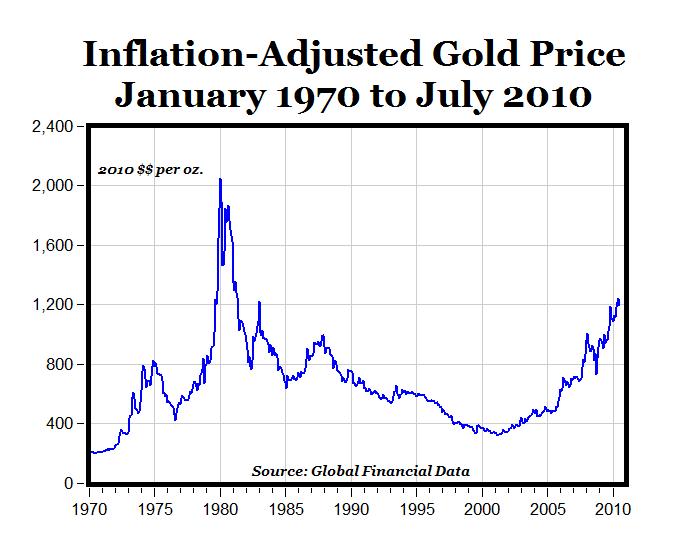
GOLD;

Personally I think we are only in the early stages of the mania phase, and this phase could last many, many years dependent upon the unparalleled consistent stupidity of regulators and rulers.


The Nasdaq chart on the left is a 12 year chart while the Gold chart is a 10 1/2 year chart. Both charts are monthly.  The point in making both charts monthly is that you, I and everyone else can clearly see there is nothing close to even the beginnings of a blow-off top in Gold yet.

Give us a call on which gold fund is the best to invest in . . 03 5724 5100

9% plus return in GBP — Brandeaux was a pioneer in providing private student accommodation in the late 1990s, and is now one of the largest investors in the sector. The Fund has a geographically diverse portfolio across the UK, which totals over 15,000 beds in residences located in 18 major university towns and cities. 

Brandeaux has developed strong university relationships and now has more than 60% of total rents secured under university nomination agreements.

Brandeaux has achieved 100% occupancy for the 2009/10 university year, as it has had for the last two years. The accommodation is marketed under the Liberty Living brand, which is synonymous with high quality and excellent levels of service. This has engendered good relationships with both universities and students.

Fund Share
Price
as at
31/08/2010
Total Return to 31 August 2010 Average
Annual
Return Since Launch
Last 12 Months 3 Years 5 Years
Student Accommodation Funds
Student Accommodation Fund (£)
Launched 15 June 2000
£2.56 +9.87% +33.33% +62.03% +9.68% p.a.

 Get in touch today on how to invest 03 5724 5100 or info @ bannerjapan.com .

Is Gold In a Bubble … And If So, How Much Further Can It Rise Before It Pops?

Posted on 16th November 2010 by Trevor in Blog |Uncategorized

by Washington’s Blog

When everyone from Jim Cramer to Mr. T is hawking gold – and when the price has risen to all-time highs – it sure feels like a bubble. 

On the other hand, the super rich – who presumably know a thing or two about investing – are buying gold by the ton.

Lewis wrote in September:  Gold prices would need to surpass USD 1,455/oz to be considered extreme in real terms and hit USD 2,000/oz to represent a bubble.

Bloomberg notes: Myles Zyblock, chief institutional strategist at RBC Capital Markets, said last month gold may soar to $3,800 within three years as it follows the pattern of previous “investment manias.”

Barron’s points out:  Louise Yamada, the eminent technical analyst who for many years worked at the various firms that have coalesced into Citigroup and now presides over LY Advisors, last week remarked in a client note that gold—based on its current trajectory—most likely wouldn’t represent a true bubble unless and until it gets to $5,200 an ounce (from its $1,317.80 December-contract close on Friday) within a couple of years.

University of Michigan economics professor Mark J. Perry noted in July that inflation-adjusted gold prices are lower now than in 1980:


Adjusted for inflation, the price of gold today is 41.5% below the January 1980 peak of more than $2,000 per ounce (in 2010 dollars). 

Frank Holmes, the CEO of US Global Investors said recently:  “If you take a look at previous cycles, super cycles, we’re far from it,” he said.  “If gold were to go to 1980 prices like most commodities have gone to, gold would be over $2 300/oz,” Holmes commented.

WJB Capital Group’s John Roque pointed out in May that the current gold bubble is still much smaller than the bubble in the 1970s when priced against the S&P.

MSN’s Money Central noted last month:  Brett Arends, a columnist for The Wall Street Journal and MarketWatch, estimated that “individuals bought $5.4 billion worth of gold, and sold about $2.7 billion, (so) their total net investment comes to $2.7 billion” in 2010, through early summer.

 Arends contrasted that with the $155 billion they shoveled into bond funds through July. That may be the real bubble.   Arends also concluded that “if it continues along the same trajectory (of past bull markets) — a big if — gold today is only where the Nasdaq was in 1998 and housing in 2003.”

 In May, Arends wrote in the Wall Street Journal:  Before we assume the gold bubble has hit its peak, let’s see how it compares with the last two bubbles—the tech mania of the 1990s and the housing bubble that peaked in 2005-06.

 The chart is below, and it’s both an eye-opener and a spine-tingler. 

[ROI_100524]

 It compares the rise in gold today with the rise of the Nasdaq in the 1990s and the Dow Jones index of home-building stocks in the 10 years leading up to 2005-06.

 They look uncannily similar to me.

 So far gold has followed the same path as the previous two bubbles. And if it continues along the same trajectory—a big if—gold today is only where the Nasdaq was in 1998 and housing in 2003. 

In other words, just before those markets went into orbit.

Quantitative Easing Explained

Posted on 15th November 2010 by Trevor in Uncategorized


Econ 101

The Fed has spent the last 15, 20 years manipulating the stock market

Posted on 12th November 2010 by Trevor in Blog


The Fed has spent the last 15, 20 years manipulating the stock market. I think they know what they do has no direct impact on the economy, the only weapon they have is the so-called wealth effect: if you can drive the market up 50%, people feel richer, they feel a little more confident, and the academics reckon they spend about 3% of that. The problem is they know very well how to stimulate the market, but they step away when the market gathers steam, and resign any responsibility for moderating a bull market that may get out of control, and I fear that the market will continue to rise, it will be continuously speculative. As a consequence you get a boom and bust… I think the Fed should settle for just controlling the money supply, not controlling the economy.” Unfortunately, it is now too late, and the Fed, which in addition to lender of last resort, is the economic “controller” of only resort, now that fiscal policy is moot, will soon have to be overthrown for its disastrous effect on the US economy to be finally eliminated.

November 2010 Finance in Focus

Posted on 4th November 2010 by Trevor in Finance in Focus

QE2 and then what?

I am still struggling as to how the Fed and/or the rest of the authorities are convincing the market on the effectiveness of further Quantitative Easing. As I commented before, it is not the price of credit, but the availability of credit is the key to an economic revival. I would take that statement a couple of steps further. The Fed can print all the money they want, but I highly question the consequences of their programs. If the money they print just piles up in the corner or it is invested in Treasury Bonds, it will not achieve any stimulus for the economy. It is preposterous to think that more credit, leverage and loose monetary policy will get us out of the mess that was created by too much credit in the first place. It was weird to see that a couple of Fed officials seem to actually agree with me.

From a fiscal point of view, of the 50 US states, we really have 20 Portugals, 10 Italys, 9 Spains, 5 Irelands, 5 Greeces, and only 1 California. And according to the International Monetary Fund, Japan’s debt accounted for 218.6% of its 2009 gross domestic product, making it the largest public debt of all industrialized nations.


 Whohoo!  GOLD  — time to BUY more! 

ALL US HOME OWNERS with a Mortgage should read this: Wondering if you are one of those paying a mortgage in limbo, with all the payments due to some non-existent mortgage note holder getting retained at the servicer banks? Well, if you can spare 3 minutes then “Where’s the Note” is for you. The website, which is on the verge of a viral break out, has a simple message: “Whether you are facing foreclosure, have an underwater mortgage, or are just a concerned homeowner, it’s important that you contact your bank and demand to see the original note on your mortgage.It only takes a few minutes using our free online tool.” Quick, simple and easy. And in a few days your mortgage bank will have no choice but to tell you if they do in fact have your original mortgage note. And if not – welcome to cost-free living, courtesy of MERS and millions of rushed and fraudulent mortgage note assignments. Yes, it will mean the end of the GSEs, but it will also mean the accelerated write downs on thousands of MBS tranches which will rapidly collapse into insolvency (there is only so much Mark to Unicorn can cover up) and eventually take the insolvent banks with them.

Mortgage Math

Some people save up their whole lives in order to have $50,000 to put down on a $250,000 home with a $200,000, 30-year mortgage at 6% so they can make 360 monthly $1,200 payments ($432,000) while maintaining the home and paying all the taxes on the land.  If they pay nothing to repair the home and just $5,000 in taxes that’s still $1,600 a month plus the $50K down.   You can play with these figures as they apply to you using this nice Bankrate Mortgage Calculator and this Compound Interest Calculator

If those same people could find a place to rent for $1,200 a month and put the $50K + $400 a month into something that just made 5% a year, they’d have $550,000 at the end of 30 years.   That’s at 5% compounded once.  If they got the 8% historical stock market average,  that would be over $1M!  A lot of people today have homes since the 70s that haven’t doubled, let alone gone up 4 times and I’ll bet they spent a good $2K a year on repairs minimum.  Another $200 a month added to the $50K at 8% is $1.4M after 30 years.

Another look at housing: Let’s back up for a second and review where the great bull market of 1950-2007 came from. That’s when a mere 50 million members of the “greatest generation”, those born from 1920 to 1945, were chased by 80 million baby boomers born from 1946-1962. There was a chronic shortage of housing, with the extra 30 million never hesitating to borrow more to pay higher prices.

Since 2005, the tables have turned. There are now 80 million baby boomers attempting to unload dwellings on 65 million generation Xer’s who earn less than their parents, marking down prices as fast as they can. As a result, the Federal Reserve thinks that 50% of American homeowners either have negative equity, or less than 10% equity, which amounts to nearly zero after you take out sales commissions and closing costs. That comes to 70 million homes. Don’t count on selling you house to your kids, especially if they are still living rent free in the basement.

The good news is that the next bull market in housing starts in 20 years. That’s when 85 million millennials, those born from 1988 to yesterday, start competing to buy homes from only 65 million gen Xer’s. By then, house prices will be a lot cheaper than they are today in real terms. The next interest rate spike that QEII guarantees will probably knock another 25% off real estate prices. Think 1982 again. Fannie Mae and Freddie Mac will be long gone, meaning that the 30 year conventional mortgage will cease to exist.

Isn’t this getting interesting?

If I couldn’t talk you out of buying that home and saving the extra money, I hope at least I have led you to consider buying a more affordable home and saving that extra money. 

And by the way, for all you parents out there, please consider putting $800 a month into your child’s account from the day they are born.  Saving $9,600 a year for 30 years gives them a nice $1,293,820.58 to buy their own first home with (or deposit for the next generation if, hopefully, they don’t need it).  With an 8.5% annualized return, putting just $300 a month into your child’s account until they are 18 gives them $153,595  for that first car (or one hell of a prom night!) or help going to university!  

Teach your children well and perhaps when they turn 18 you can arrange to match them 2:1 and they come up with $150 and you with $300 and you maintain that deal for 12 more years.  Using the Calculator, put the $153,266 as an initial deposit and add $5,400 a year ($450/month) for 12 more years at 8.5% and what do we get?  $523,360.75 to get your kid or grand-kid started in life at age 30.  All you have to do is commit yourself to $300 a month and, aside from the cash, perhaps you will also teach your children a very valuable life lesson in investing that will be passed down to generations of wealth builders in your family.

Call Banner today we can help 03 5724 5100