GOLD — 2012~2017
Gold is not going to go up because of all the conspiracy claims nor because the real gold will conquer the paper gold. This is all about reality. Gold is a viable part of the portfolio. It will rise to the occasion when the timing is right. The very people accused of keeping it down are the very people who will turn around and send it up as well. This is just about time. Nothing more! When the time is right and people realize that the Governments have no Clothes, look out – there will be a stampede at that time. For now, that still appears headed into 2015~2017.
Gold is neutral and the next turning point will be a big one September. Monthly closing resistance remains at 1755 and the primary resistance for the next 6 months is still 1807. The primary support lies at 1570 and 1480. Thus, as long as gold remains within 1807 to 1480, it is effectively neutral, so slowly and patiently accumulate!
Under a gold standard, the yellow metal DECLINES with inflation and rises with DEFLATION precisely opposite when it is a free floating market. So let’s get this straight. Gold rallied after 1934 because (1) Roosevelt confiscated gold, and (2) devalued the dollar raising gold from $20.67 to $35.
Gold is a good investment NOT because of all the fiat nonsense, but because inflation has passed it by and there will be a huge burst of price movement. That will come when the Sovereign Debt Crisis hits the USA and that does not seem likely until the autumn of 2015.
If you take a look at a 5 year chart of the gold stock ETF (GDX) vs. the gold bullion ETF (GLD), gold mining stocks are up about 25% from where they were 5 years ago, while the price of gold is up about 145%! Gold has risen about 5.8X more than gold stocks, when it should be the other way around considering how rapidly the profitability of gold miners is surging!
Last 5 years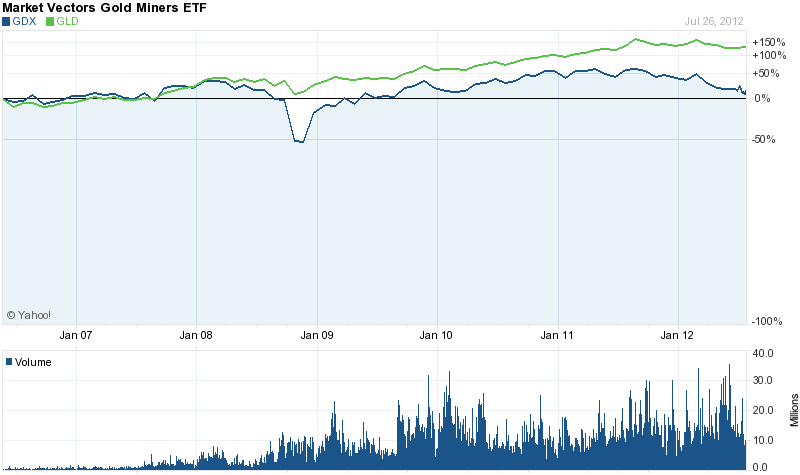
We believe gold has the potential to rise 24% to $2,000 per ounce in 2013, but I also believe gold stocks will outperform gold bullion for the rest of 2012! The average gold stock has the potential to double before year-end, with some small-cap gold stocks making huge gains. What would cause this to happen? The Fed – If they start a new QE program or even if they specify a new program with the specific term “FLOW” of purchases to keep rates low and buy say $50 to $75 billion per month of bonds this will be the catalyst to send gold beyond 1807 on its way too $2,000 and beyond. We have a couple of great options on how to invest in gold give us a call to find out more. 03 5724 5100
Shorter Term GOLD
Gold and silver have taken more of a back seat over the past 12 months because of their lack of performance after topping out in 2011. Since then prices have been trading sideways/lower with declining volume.
Bullish Case: Euro-land starts to crumble, stocks fall sharply sending money into gold and silver which are trading at these major support levels which in the past triggered multi month rallies.
Bearish Case: Greece, Spain and Italy work through their issues over the next few months while metals bounce around or drift higher because of uncertainty. But once things have been sorted out and financial stability (of some sort) has been created and the END OF THE FINANCIAL COLLAPSE has been avoided money will no longer want to be in precious metals but rather move into risk-on.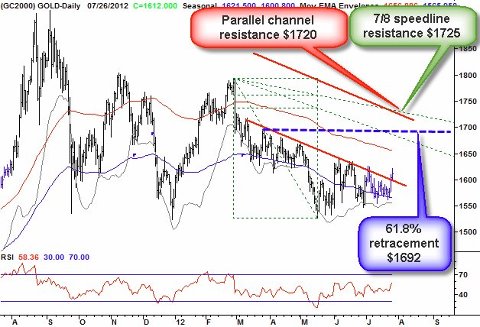
Over the next few months things will slowly start to unfold and shed some light on what the next big move is likely going to happen to gold and silver. The price movements we have seen for both gold and silver indicate were are just warming up for something really big to happen.
The Pew Center has released its annual summary of US pension and retirement health care (under)funding. As of 2010, the total underfunding gap rose by $120 billion from the prior year’s $1.26 trillion deficit to a record $1.38 trillion underfunding. This number consists of $757 billion in pension promises, not backed by any hard cash, representing pension liabilities of $3.07 trillion and assets of $2.31 trillion. In 2000, more than half of the states had their pensions 100 percent funded, but by 2010 only Wisconsin was fully funded, and 34 were below the 80 percent threshold—up from 31 in 2009 and just 22 in 2008. But that pales in comparison to the ridiculous spread between retiree health care liabilities of $660 billion and assets of, drum roll, $33 billion, or a funding shortage that is $627 billion, roughly 19 times the actual assets in the system! Just seven states funded 25 percent or more of their retiree health care obligations: Alaska, Arizona, North Dakota, Ohio, Oregon, Virginia, and Wisconsin. What this means is soon US pensioners will have no choice but to experience not only austerity unlike any seen in Europe, but broken promises of retirement benefits which will never materialize. The response will likewise be proportional.
Sadly, it is only going to get worse. So what should you do? Take out a personal savings plan . .. general details here
